
Letters to York Council 2023
- #17apr23: York’s shameful open secret
- #03apr23: Local plan tilts towards developers
York’s shameful open secret
Dear Councillor,
York’s climate emergency
In 2019 York Council declared a climate emergency. It also commissioned a report from Professor Andy Gouldson of Leeds University (and others) to guide York Council policies.
Professor Gouldson’s report, A Net Zero Carbon Roadmap for York, calculated York’s fair share of the world’s remaining carbon budget. The global budget sets the limit of greenhouse gases that humanity can emit before the dangerous limit of 1.5C is exceeded.
The Gouldson report calculated York’s remaining carbon budget using an IPCC report, the SR 15 report. York’s fair share of the global budget was just over 10 million tonnes of greenhouse gas (measured as CO2equivalent) from 2020. That amounts to roughly 50 tonnes CO2e per citizen.
This means that if the average citizen in York causes the emission of more than 50 tonnes CO2e from a starting point of 2020, York will have exceeded its fair share of the global carbon budget and will have contributed disproportionately to the Earth’s approaching climate disaster.
Measuring York’s carbon budgets and carbon emissions
Estimating carbon budgets and greenhouse gas emissions is fraught with problems. The figure from IPCC SR15 report, used in the Gouldson report was based on a 66% probability of staying below 1.5C. Gouldson could have chosen the 50% probability, which allows a larger budget of 70 tonnes CO2e.
The Gouldson report also uses Carbon Dioxide equivalent (CO2e) as a measure so its budget includes the effect of other greenhouse forcing agents, such as methane, black carbon and nitrous oxide. On these considerations, the “Gouldson budget” may be considered to be too low.
For statistics on emissions, the Gouldson report only uses a part of York’s greenhouse emissions: Those based only on the fuel and electricity directly used within York’s boundaries. This ignores air travel and the emissions caused by imported goods. The report’s partial estimates of York’s yearly emissions amount to 4.2 tonnes CO2e per York citizen.
According to the website carbon.place, York’s carbon emissions were just over 8 tonnes CO2e per citizen (in 2019?), just short of the 8.3 tonnes per person for the UK. This national consumption estimate is between other estimates.
Estimates of UK carbon emissions by the Department for Business, Energy & Industrial Strategy for 2019 were 6.8 tonnes CO2e per citizen. For the same year, the Department for Environment Food and Rural Affairs estimated the UK’s carbon emissions, as 11.6 tonnes per UK citizen.
Another estimate of UK national emissions is from Professor Mike Berners Lee in his book, How Bad are Bananas,(2020). His estimate of the average carbon emissions for a UK citizen was 13 tonnes CO2e per year.
The differences in estimates are due to different methods and what the estimates do, and do not, include. The table below is a summary:
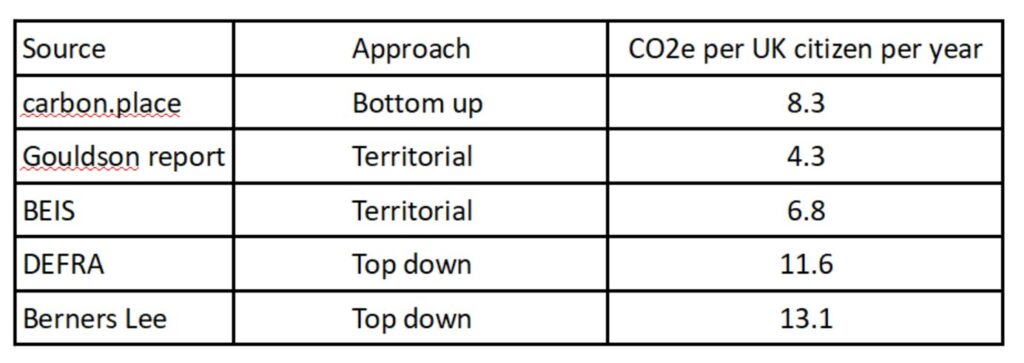
The differences between approaches are these:
1. Bottom up approach adds up estimated carbon emissions based on estimates of consumption using official sources like the Family Expenditure Survey.
2. The territorial approach only counts emissions based on emissions that occur within the UK. This ignores things like international air flights and the emissions made during the manufacture of goods that we import.
3. The top down approach uses input-output analysis. This which traces the flows of money through the economy before assigning emissions to its end uses.
Advocates of the top down approach claim that it captures captures more of the emissions due to consumption. A reasonable conclusion is that the estimates of emissions shown by carbon.place are underestimates when the full count of emissions is considered but, with that in mind, they are a good source of data for this note.
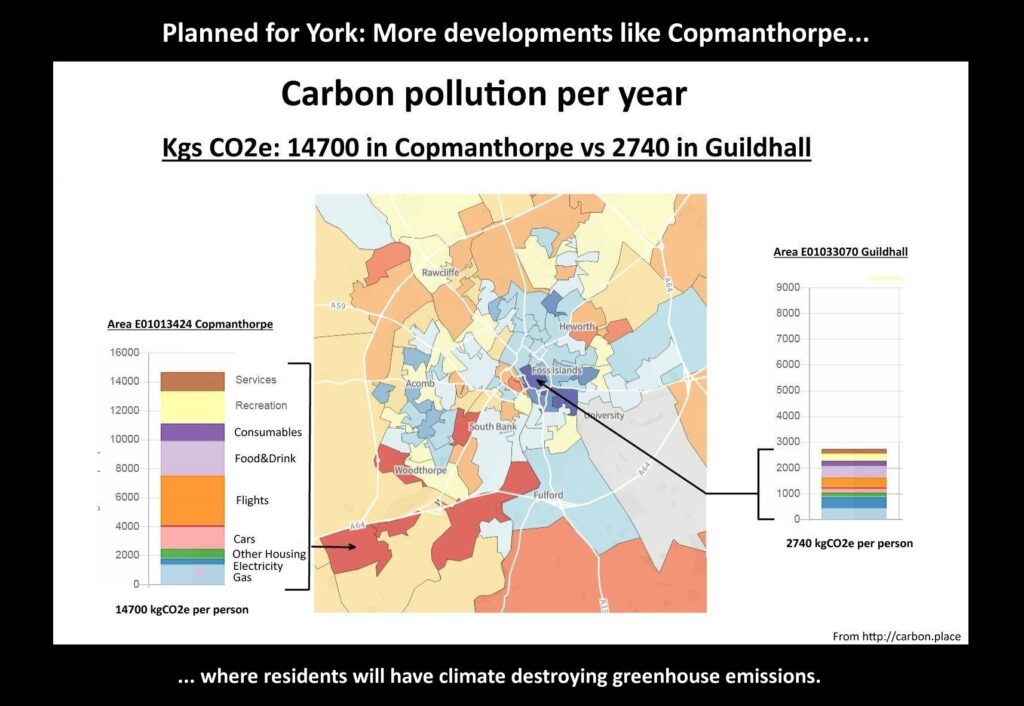
Carbon.place is one of the few sources (only?) which attempt to model the emissions in small geographical areas. These are called Lower Super Output Areas. LSOAs have an average of 650 households. York contains 120 LSOAs.
“Secret” emissions of the affluent
Has York Council any documentation that discusses the need to reduce the enormous gap in carbon emissions between the richest and poorest communities in York?
The council does not have specific documentation as requested therefore this information is not held.
The local plan tilts towards developers
Dear Councillor
The Local Plan tilts the balance for future negotiations towards developers
In their National Balance Sheet, the Office of National Statistics publishes estimates of “land value”.
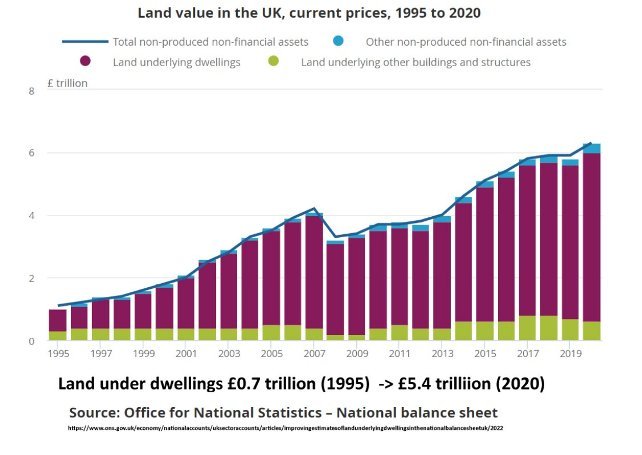
This shows that land under dwellings is worth over £5trillion. Increased from £1trillion in the mid 1990s. The land, as land, is worth only a tiny bit of this. Most of the £5trillion is the right to have a building on the land. That’s a Property Location Right – historic or created by planning permission.
With roughly 25 million dwellings in the UK, the average value of a Property Location Right is about £200K per house. This means granting planning permission for a house is granting about £200K of “planning value” to the land owner or developer. Elsewhere I have estimated similar figure for York.
On this calculation, the York Local Plan is allocating roughly £3.6 billion in new property location rights as it plans for 18,000 new dwellings. This is also called planning gain and it accrues to the land owner (who may also be a housing developer). When planning permission is acquired the land can be sold on at its enhanced value even before any building work takes place.
£3.6 billion in planning gain is a large sum to authorise through the York Local Plan – it is about 30 times the budget of York Council – but it is much smaller than the total rise in property values in York. Over the past decades house owners have seen very large increases in values. In total, they have benefited by much more than land owners,
The size of the benefits (to land owners and houseowners) is determined by the demand and the supply for houses. The demand (as some commentators have noted) has increased as a result of government policies after the banking crisis of 2007. These policies left the rich with more money than they could spend – so they bought property. On the supply side the number of houses being built is limited by the planning system and the pattern of land ownership. This means the poor get poorer and the rich get richer as the poor (and young) pay more rent to the rich and affluent who increasingly own the houses.
How is this situation affected by the York Local Plan? According to the Council’s Press Department, the Local Plan, once adopted, will:
• create and protect a permanent green belt
• support the creation of 18,000 homes, including over 4,000 new affordable homes
This Local Plan locks in place sites where houses can be built. Developers (as land owners) will have a veto over what can be built on their land. They can build when it becomes profitable but need not when it is not. In any negotiation this gives most of the cards (or all of them) to the developers. The council will be in a very weak position to demand that enough affordable homes be built – if they dent developers’ profits. Given the current financial crisis it may be some time before developers feel comfortable to build.
We should note that a plot of land big enough to site a house could cost less than £1000 at agricultural prices. Giving planning permission adds about £200,000 to its value. A bonus for the landowner. This adds to the price of a new house, with the side affect of keeping the value of all houses high.
The poor will gradually be squeezed out of York but perhaps this is the sentiment behind the plan: Exile the poor and continue the trend to change York from a working class manufacturing city into a middle class university city, from making glass, trains and chocolate to providing higher education and services for tourists.
The current Local Plan will lock this trend in, with high housing costs the poor cannot afford.
Best wishes
Geoff Beacon
TrackBack URL :