
Climate, Planning, Economy. Tips 61+
0↓
Contents #61
- #61: Subsidise goods that use lots of labour
- #62: Local inequality in greenhouse gas emissions
- #63: Net-zero is a smoke screen
- #64: Perverse language in IPCC SR15 downplays Ocean Heat Content
- #65: Lucky old Sun – and a common myth
- #66: Cars and choice
- #67: The York Local Plan
- #68: Are BEVs better than ICE cars?
- #69: Does GWP*, cheat on climate targets?
- #70: Land value tax could bring a little fairness
Goto 1 11 21 31 41 51 61 71 81 91
↑ #61 Subsidise goods that use lots of labour
Tax those that don’t.
The rationale is simple, if there is unemployment, there is spare labour . A good way to use that labour is to consume goods that use it. A policy that could bring this about is to “subsidise goods that use lots of labour and tax those that don’t”.
See a report to the European Commission proposed changes to VAT to achieve this.
For those frightened by the word “subsidies”. These were not subsidies that should cause too much anger in free-marketeers. The “subsidies” in this scheme are tax breaks allocated on a uniform for-every-worker basis. Being tax-breaks they are never actually paid out by government, except in the unusual case where the tax breaks exceed the VAT which would have been paid. In correspondence HM Treasury has agreed these tax rebates are not government expenditure.
Greenhouse gas reduction will be very difficult without reducing economic activity. Restricting economic activity will cause the demand for labour to drop. Also machines and robots are rapidly displacing labour.
To safeguard the structure of society, jobs should be preserved. This shows one mechanism for doing that. To repeat
“Subsidise goods that use lots of labour. Tax those that don’t.”
↑ #62 Local inequality in greenhouse gas emissions
Within the boundaries of a planning authority greenhouse gas emissions can vary greatly.
Councils should be trying to persuade – and eventually to cajole – residents in the areas with highest personal emissions to reduce their impact on the Earth. Most local authorities will have areas where emissions are very high.
However, the councils themselves need to know the details of the problem, and start the process of persuasion and cajoling. A website carbon.place can be used as a tool for identifying local areas of high carbon emissions.
As an example, the table below shows how some authorities in Lincolnshire that may benefit from knowing where residents with large emissions live. The table gives emissions for small areas, within the local authority with the highest and lowest average personal emissions.
The small areas are Lower Super Output Areas, which have average populations of 1500 people.
| CO2e: highest emitting area | CO2e: lowest emitting area | Ratio | Local Authority | |
| 13.1 | 4.2 | 3.1 | Grimsby | *1 |
| 10.0 | 2.8 | 3.5 | Lincoln | *2 |
| 13.9 | 2.1 | 6.7 | Scunthorpe | *3 |
| 10.2 | 4.3 | 2.4 | Cleethorpes | *4 |
Within these local authority areas, the emissions of highest emitting areas, vary from 2.4 times to 6.7 times the emissions of the lowest emitting areas. The highest emitting areas will also be much wealthier as well as much more polluting.
| Small areas with highest emissions | Small areas with lowest emissions | * |
| ‘Ageing rural neighbourhoods’ in Wolds | ‘Endeavouring social renters’ in Croft Baker | 1 |
| ‘Ageing suburbanites’ in Hartsholme | ‘Cosmopolitan student neighbourhoods’ in Boultham | 2 |
| ‘Remoter communities’ in Ridge | ‘Constrained renters’ in Ashby | 3 |
| ‘Remoter communities’ in Croft | ‘Primary sector workers’ in Ingoldmell | 4 |
Local planning authorities should note that planning for high carbon lifestyles is contrary to the National Planning Policy Framework, which says:
At a very high level, the objective of sustainable development can be summarised as meeting the needs of the present without compromising the ability of future generations to meet their own needs
National Planning Policy Framework
https://assets.publishing.service.gov.uk/government/uploads/system/uploads/attachment_data/file/1005759/NPPF_July_2021.pdf
↑ #63 Net-zero is a smoke screen
“Should [net-zero emissions] be achieved globally, “surface temperatures stop warming and warming stabilizes within a couple decades,” said Michael Mann,”
https://www.theguardian.com/environment/2021/jan/07/global-heating-stabilize-net-zero-emissions
This gives the wrong impression that if “net-zero emissions” were to be achieved, then the Earth’s Energy Imbalance would be zero (setting aside the steady flow of heat from the molten core).
At net-zero emissions (and stabilised surface temperature), the Earth would have an energy imbalance which would be heating oceans, melting ice and thawing permafrost, but not increasing Earth’s average surface temperature.
The Earth would still be warming (i.e. accumulating heat) and there would be consequences. e.g. sea-level rise, dying oceans and permafrost feedback.
At net-zero warming does not stabilise – only the surface temperature, while Earth’s interior continues to warm.
Emissions need to be net-negative.
Net-zero is a smoke screen.
↑ #64 Perverse language in IPCC SR15 downplays Ocean Heat Content
“Reaching and sustaining net zero global anthropogenic CO2 emissions and declining net non-CO2 radiative forcing would halt anthropogenic global warming on multi-decadal timescales.”
IPCC SR15, Summary for Policy Makers, https://www.ipcc.ch/sr15/chapter/spm/
This actually means that the average temperature of the air just above the Earth’s surface stops rising. This temperature is called Global Mean Surface Temperature (GMST). It can be used as a measure of the heat near the Earth’s surface and in the atmosphere above.
However, this heat is a small percentage of the heat that is accumulated in the Earth by the greenhouse effect. Over 90% of this “greenhouse heat” finds its way into the oceans mostly by direct warming. Other sources of this greenhouse heat are the latent heat of melted ice mass and thawed permafrost.
Broadly speaking, while GMST is above pre-industrial levels, Ocean Heat Content is still increasing, ice sheets are still melting and permafrost is thawing.
It may be true to say “Global Mean Surface Temperature has stopped rising” but only in a perverse meaning of “warming” has “anthropogenic global warming” been halted.
↑ #65 Lucky old Sun & the myth of living on your wages.
Up in the mornin’
Out on the job
Work like the devil for my pay
But that lucky old sun got nothin’ to do
But roll around heaven all dayI’ve got to work for my family
Aretha Franklin – That Lucky Old Sun
Toil for my kids
Work till I’m wrinkled and grey
But that lucky old sun got nothin’ to do
But roll around heaven all day
A hidden myth
There is a myth hidden in these lyrics. Together “Work like the devil for my pay” and “I’ve got to work for my family” imply a hidden assumption. This assumption is that individuals (or families) should be able to be live on wages alone (i.e. by the sale of their labour).
Practically, this is impossible, so policies such as unemployment benefits have been introduced to support those that cannot find work and disability benefits for those unable to work.
This assumption that it is always possible to have a decent standard of living through hard work has an underlying (but inappropriate) morality. It leads policy makers to try to banish poverty through full employment (so most people have wage income) with a high demand for labour (so wage income is as high as possible.)
Producing more stuff damages the climate
Market forces ensure that high paid jobs need high productivity. Full employment with higher productivity means producing more stuff.
Stuff_Produced= Workforce * Productivity
An increase in productivity means more stuff produced.
But more stuff produces more Greenhouse Gases to damage the climate.
Production and Emissions Intensity
Carbon dioxide is the most important greenhouse gas: Its emissions are the major cause of climate change.
The relationship between the level of production and CO2 emissions can be expressed using the factor Emissions_Intensity. So …
CO2 emissions = Stuff_Produced * Emissions_Intensity
[Note: If stuff worth $1000 is produced and the resulting CO2 emitted is 300 Kgs. this would mean Emissions_Intensity is $0.3 KgsCO2/US$. ]
Lower Emissions_Intensity or lower wages
The two equations above can be combined so that:
CO2 emissions = Workforce * Productivity * Emissions_Intensity
CO2 emissions can be reduced by reducing the Workforce, Productivity or Emissions_Intensity. If full employment is desired, the workforce cannot be easily reduced, so a reduction in Productivity and/or Emissions_Intensity is required.
Over several decades, Emissions Intensity has been falling. According to the Global Carbon Project (2018), it is falling about 2% a year globally, but (until the recent disruption of production from the Covid pandemic) emissions have not been falling at all: Atmospheric concentrations of CO2 are still rising.
If the climate is to be saved, CO2 Emissions must fall much faster than falls in Emissions_Intensity. This means producing less stuff. If the workforce is not reduced, the average worker must produce less and productivity per worker must fall. Without correcting mechanisms, this means wages must also fall.
Non-wage income
To avoid poverty, individuals and families must have non-wage income to allow less productive work. e.g. universal basic income or negative income tax. Labour subsidies, could also encourage the market to create jobs with lower productivity.
We must dispel the myth that the economy must be driven at a climate destroying pace just to give a decent wage to the poorest in the world.
Universal non-wage income is required.
See also:
- Oxford Economics 1: Robots and climate
- Before the robots take all our jobs
- Models of reducing carbon emissions
- The job apocalypse and climate change
- Oxford Economics 2: Chasing productivity
- Jobs, training and video games (1993)
↑ #66: Cars and choice
- Choice based car use
- The parable of the smoking carriages
- Choose Venice over Los Angles – and save the world.
- Highway Robbery (1971)
- Lifestyles, carbon emissions and consumer surplus
Research by the University of Leeds found that, providing the choice of other means of transport did not reduce car use:
We have suggested that in this English and Scottish case study decision-makers accept the argument that choice-based approaches will lack effectiveness in reducing carbon, and that substantial change requires changing the conditions and circumstance which shape possible behaviours.
Cars have taken over communal space:
Once upon a time children used to play in the streets. outside their homes, cycle clubs would go out for a spin in the country at the weekend and people would walk around or stop and talk in the city centre streets or their local high street. Now traffic has taken most of the space that was used for these activities. It has in fact, completely taken over the major supply of easily accessible land – the public highway.
Given the choice many would choose to live car-free:
Many would love to get away from the expense, rush and pollution of “modern living” and its mass car use, just as train passengers in the UK voted with their feet when they were able to separate themselves from the smokers: Those smokers stopped smoking on trains rather than suffer the pollution of their fellow smokers.
For the economists: Motorists destroy non-motorists’ consumer surplus:
If one section of the population (e.g. motorists) cause a fall in the
consumer surplus of another section (e.g. bus users), how should
economists regard this? Can it be classed as an external cost?Dr Antoine Dechezleprêtre of the Grantham Institute has kindly allowed me to publish his answer.
The answer is “Yes”.
↑ #67: The York Local Plan

- Silenced at the York Local Plan Inquiry
- The York Local Plan: Climate Change
- The York Local Plan: Exiling the poor
- Submission to the Public Inquiry on the 2018 York Local Plan
In July 2018, I was refused a late submission to the York Local Plan Inquiry. In December 2020, I am still questioning the circumstances of the refusal.
In the summer of 2019, I thought I had another chance so submitted more evidence, and it seemed my submission was accepted and I was given a place on the table at day one of the hearings to present my evidence. I sat through the morning waiting my turn to speak on the plan’s effect on climate change.
However, I was approached during the lunch break and told I could not speak. The screen shot of the video of the session, above, shows me, Geoff Beacon, leaving.
↑ #68: Are Battery EVs better than ICE cars?
In Cars or Planet, estimates of the carbon footprints of cars has a wide range, with lifetime footprints of centering around 40 tonnes CO2e for mid-range Internal Combustion Engine cars (ICE cars) and 25 tonnes CO2e for mid-range Battery Electric Vehicles (BEVs). Both estimates might be higher if top-down methods for estimating embodied carbon were used.
These estimates show most cars as climate killers, easily overwhelming any remaining carbon budget.
A step in the right direction would be to change what cars are and make them lighter and slower:
Most modern cars weigh rather more than 1 tonne and have top speeds well over 70mph: e.g. A Ford Mondeo weighs over 1.7 tonnes an has a top speed of 116 mph upwards.
These cars carry people who, on average, weigh 5% of the car’s weight and in neighbourhoods, villages, towns and cities “twenty’s plenty”. Let’s replace the car monsters with new vehicles, weighing less than 150 kgs designed for speeds less than 20 mph.
↑ #69: Does GWP*, cheat on climate targets?
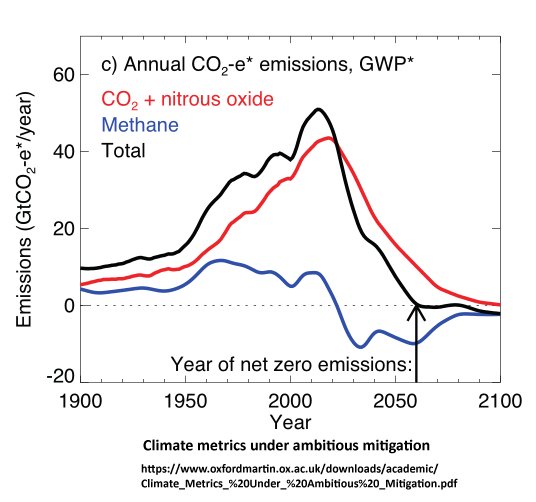
When GWP* is “net-zero” CO2 & CH4 emissions are not zero.
- GWP* should not be adopted by the IPCC
- Cheating with temperature
- Instant Earth & Cumulative Earth.
- The CCC should advise the Government that …
A new method of measuring the effects of combined greenhouse gases has been proposed, particularly for measuring CO2 and methane. This new metric may be relevant to the interpretation of international agreements. The Committee on Climate Change says in Land use: Policies for a Net Zero UK :
A new usage of the GWP 100 metric (named GWP*) has recently been developed to recognise the difference in how sustained emissions of methane and CO 2 /N 2 O affect global average surface temperature, which is not fully captured by the current metric.
And :
This new metric will be assessed by the IPCC as part of its forthcoming 6th Assessment Report.
When GWP* is “net-zero” neither CO2 emissions nor CH4 emissions are zero.
Will this be used to move the goal posts for emissions targets?
↑ #70 Land value tax could bring a little fairness
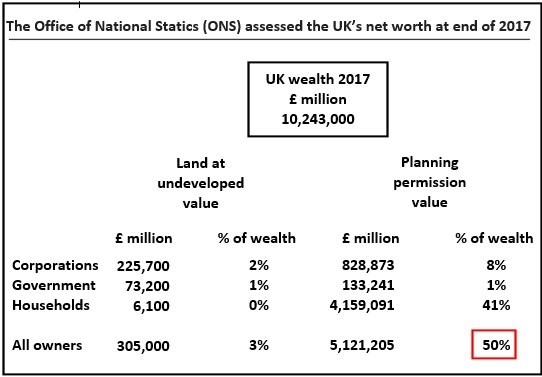
It may be desirable to have a managed supply of very cheap housing, but the political power of landowners and house owners would limit such policies.
Mass cheap housing would also worry the Bank of England. It could threaten the stability of banks: Banks which have made loans against inflated house prices.
However, there are other options. Land Value Tax (LVT) is one with a long history. It is supported by a range of political opinions, from the New Economics Foundation to the Adam Smith Institute .
TrackBack URL :