
Climate, planning, economy. Tips 11+
0↓
Contents #11
- #11: Greenhouse gas emissions by neighbourhood
- #12: National Planning Policy Framework
- #13: New settlements are best car free
- #14: Wealth increases greenhouse gas emissions
- #15: A new motorist into a town creates large emissions
- #16: Greenbelts reward the rich and affluent
- #17: Just say no to demolition
- #18: Ignore UK Business Department “lie”
- #19: SCATTER data ignores many emissions
- #20: Campaign on emissions
Goto 1 11 21 31 41 51 61 71 81 91
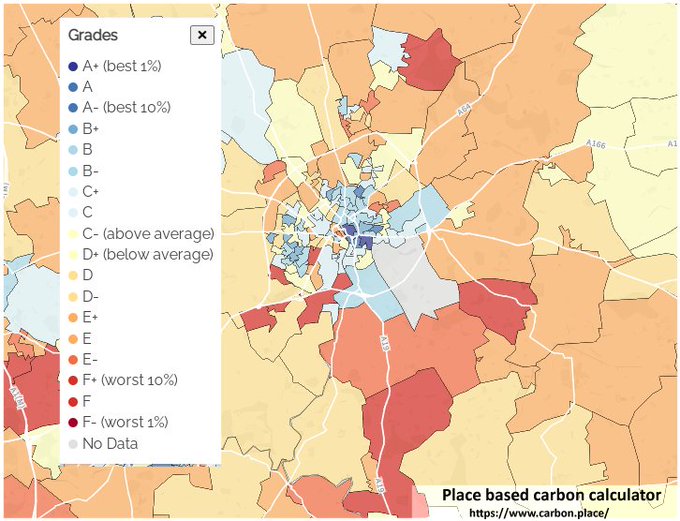
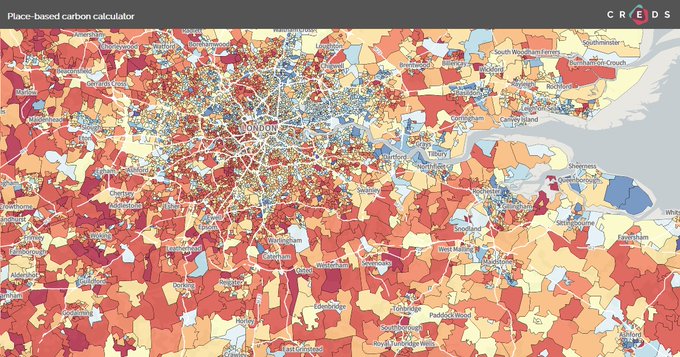
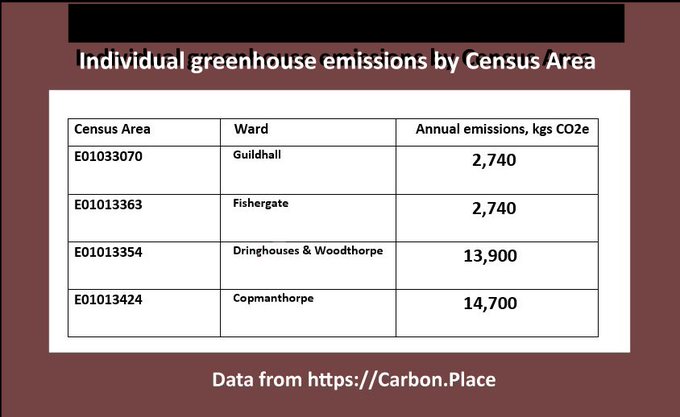
↑ #11: Greenhouse gas emissions by neighbourhood.
Compared to Centre of York, personal emissions are:
- 5.4 times more in ‘Comfortable” Copmanthorpe
- 5.0 times more in ‘Affluent’ Strensall
(See Place Based Carbon Calculator)
↑ #12 National Planning Policy Framework
NPPF incorporates UN resolution 42/187 so
– planning high carbon footprints breaches NPPF
Some sites in York Local Plan will have footprints like Strensall that are 5 times more than in York Centre
– violating the NPPF

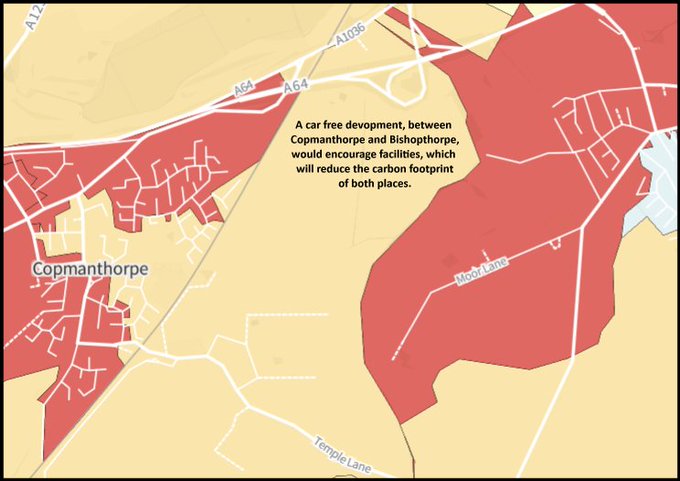
↑ #13 New settlements are best car free
…with shops, doctors, schools, nurseries, pubs & cafes within a few minutes’ walk.
Placed next to car-based areas with high carbon footprints, new settlements can help polluting places by boosting local facilities.
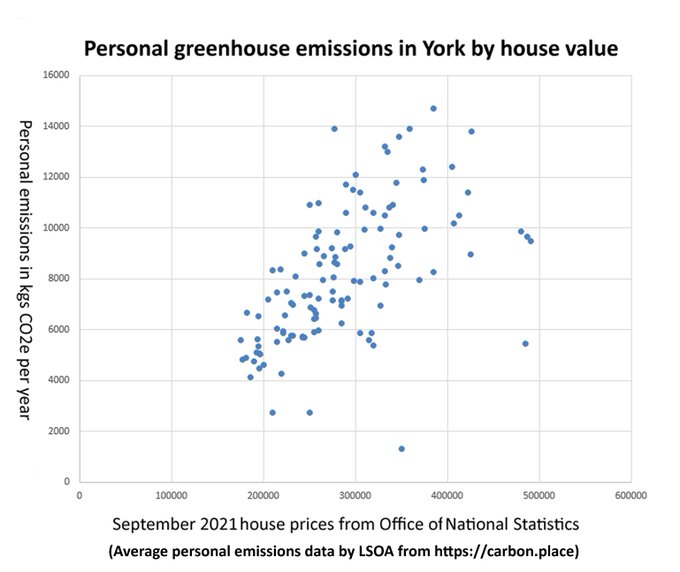
↑ #14 Wealth increases greenhouse gas emissions
In York, for every £100K increase in house value …
… average personal greenhouse gas emissions rise by over 2 tones CO2e per year.
(Data from http://carbon.place & Office of National Statistics)
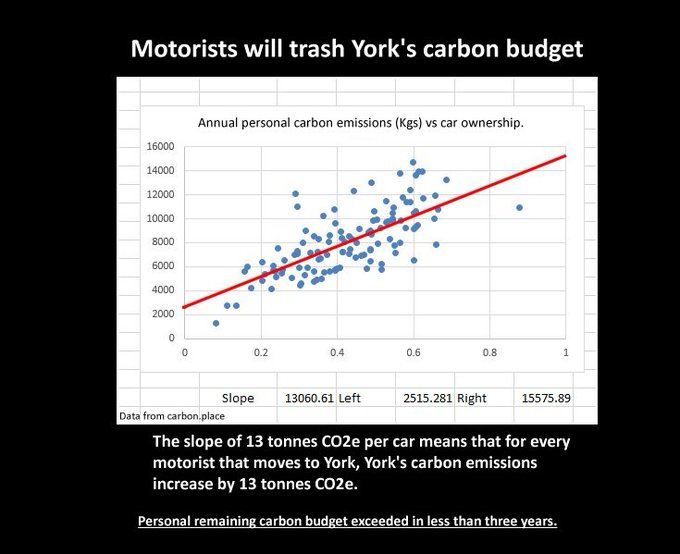
↑ #15 A new motorist into a town creates large emissions
The underlying data in https://carbon.place shows …
The effect of new motorist into York creates such large emissions (not just driving) that carbon budgets are exceeded in less than three years.
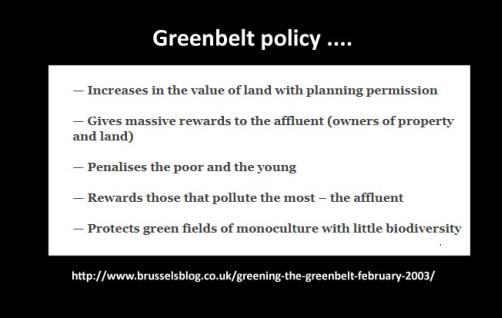
↑ #16 Greenbelts reward the rich and affluent
Greenbelts reward
Affluent house owners and rich landowners
Greenbelts penalise
The poor and the young
… by increasing the cost of housing
(From 2003: http://faxfn.org/greeningthegreenbelt/)
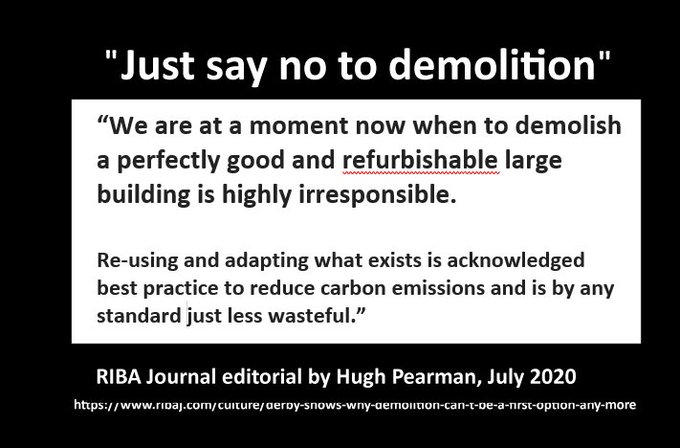
↑ #17 Just say no to demolition
Planners should refuse consent for buildings to be demolished, if they can be refurbished.
Demolition causes enormous carbon emissions.
Make developers asses the emissions from demolition vs. refurbishing.
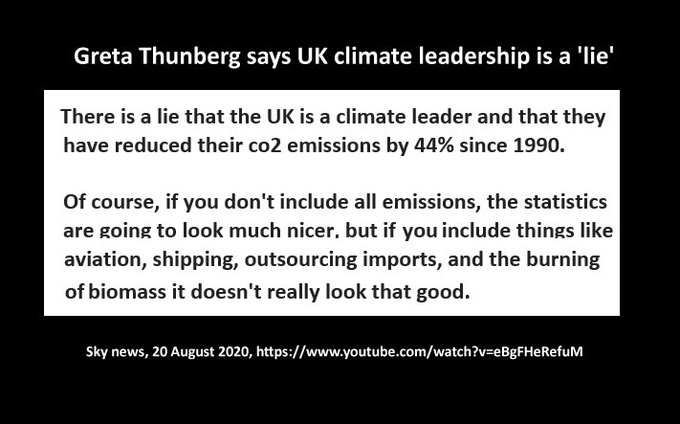
↑ #18 Ignore UK Business Department “lie”
After 2008, climate policy moved from Environment Dept to Business Dept, BEIS.
BEIS stats “show” UK has cut emissions enormously.
If councils use a local version of BEIS stats, would Greta say they lie too?
BEIS funded the SCATTER data tool, intended for use with local authorities
19
↑ #19 SCATTER data ignores many emissions
Councils now use SCATTER data https://scattercities.com
Like BEIS, it ignores many emissions caused by residents. e.g. Aviation emissions ignored unless there is an airport within council boundaries.
So no aviation emissions for Knightsbridge?
↑ #20 Campaign on emissions
Derwenthorpe: Largest individual emissions were 4 times the smallest.
York: Areas with largest average emissions are 5 times the smallest.
Needed: Climate campaigns like York’s campaign on engine idling.
Begin with worst areas.
TrackBack URL :