
The York Local Plan: Exiling the poor
The York Local Plan: Exiling the poor
Submission to the Public Inquiry on the 2018 York Local Plan
Geoff Beacon, July 2019
2.5 To ensure a continuous supply of housing opportunities throughout the plan period sustainable sites should be brought forward. By the end of the plan period sufficient sites will have been identified for viable and deliverable housing sites with good access to services and public transport to meet the housing needs of the current population and the future population linked to the city’s economic growth ambitions. This will require the provision of sufficient land for 867 790 dwellings per annum and will include substantial areas of land for ‘garden village’ development delivering exemplar new sustainable communities at Land West of Wigginton Road, Land East of Metcalfe Lane and Land West of Elvington Lane, along with major sustainable urban extensions such as British Sugar and York Central. In addition, the plan will optimise the delivery of affordable housing to meet identified need subject to not compromising viability of development sites; and address the needs of specific groups.
PM3 – Explanation of City of York Housing Needs
City of York Local Plan Proposed Modifications (June 2019)[1]
The value of planning permission
Under the headline Land and house prices push UK’s total worth up to £10 trillion, Tim Wallace of the Telegraph wrote:
Land is now worth £5.4 trillion, which amounts to 53pc of all wealth in the country. This is up from one-third of net assets in 1995, and means land is close to its record high share of 53.3pc of total worth, which it hit in the boom years of 2006 and 2007.
and
Housing wealth makes up 17.8pc of the UK’s net worth and added to land this takes the two to a total of 70.7pc of net assets.
As I explain in Nonsense on Land Values, there is a misconception here about the way the Office of National Statistics (ONS), divides the value of a house into two parts:
(Part 1) The bricks and mortar value and
(Part 2) the value of the land that the house is built on.
The ONS specifically notes under Table 10 of The UK national balance sheet estimates that house values – using their definition – “Excludes the value of the land underneath the assets.” i.e. excluding the value (Part 2) of the land that the house is built on.
What we think of as ‘land’ is undeveloped land. It has a total value in the UK of probably less than £500 billion. (£500 billion values the UK’s 24.2 million hectares of ‘land’ at more than £20,000 per hectare – probably an overestimate.) The difference between this £500 billion and the £5,400 billion of ‘land value’ in the ONS figures is due to what the ONS
classes as the value of the land that buildings stand on.
This classification gives a very misleading impression. If your house were demolished and there was no chance of rebuilding the value of that land would be tiny. What makes that land valuable is the right to have a house on your land. That right is called planning permission. That, in turn, gives value to the “house plus land”. This combined value is what is normally considered “the value of a house”.
The ONS should prevent these confusions and separate out the value of planning permission from the value of undeveloped land.
Using ONS figures, the value of planning permission – the right to have a house in a particular place – can be estimated. It is about 70% of the value of an average UK house:
Only 30% can be allocated to its “bricks-and-mortar value”. These are average values over the UK. In places where demand for housing is low the value of the planning permission can be very low. In places of high demand for housing, it will can be considerably higher than the 70% average.
When planning permission is attached to land large increases in value can occur. This will happen with planning permission is granted for development – as in the York Local Plan. This uplift in value is called planning gain.
The next sections attempt to estimate the total value of planning gain in the York Local Plan.
Planning gain in the York Local Plan: Estimate 1
According to the Department for Communities and Local Government in December 2015, the price of agricultural land in Yorkshire and the Humber was estimated as £21,000 per hectare. In York, the value of a hectare of building land was estimated as £2,710,000. Planning permission turns agricultural land into building land. This is planning gain, increasing the value of land by 128 times.
Planning gain is a windfall to the landowner – before any building starts. At the recommended rural density of 35 dwellings per hectare this estimates planning gain per dwelling as £77,000. This adds to the cost of a new house in York, when in a greenfield setting. In contrast, a similar calculation gives the planning gain for a house in Liverpool as £27,000 per dwelling, £50,000 less than in York.
However, recent searches on the housing website, Zoopla, give the value of a typical new three bedroomed house in Liverpool to be in the £100,000 range but in York they are in the order of £300,000; a difference of £200,000. In York the cost of a new house is about £200,000 more than a similar one in Liverpool.
According to RICS data, building costs in Yorkshire & Humberside are about 1% higher than in the North West. Rates of Community Infrastructure Levy (CIL) may vary across the country but they are not large enough to cause much difference to house prices. In most areas, the CIL for a standard house will be just a few thousand pounds.
The difference in house prices between Liverpool and York is not caused by building costs or other development costs that are subject to competitive market pricing. Nor is it caused by differences in CIL. It is planning gain that soaks up the difference. This suggests £77,000 is a gross underestimate of planning gain in York.
Planning gain in the York Local Plan: Estimate 2
To make an alternative estimate of planning gain, I will use the relationship
Planning gain = Selling price – development cost – agricultural land price
Here, I will use a value of £900 per square meter for building cost. This is from The City of York Local Plan Viability Study (2014) by Perter Brett and Associates (PBA). This is slightly higher than RICS data for the Yorkshire and the Humber Region.
The PBA figure gives the building cost of a new 85m2 house in the as £76,500 but other costs should be added: external works (10%), professional fees (10%) and contingency (5%). This becomes £100,500.
Adding further sums for financing (7%), developers profit (20%), site purchaser’s costs (6.5%) and marketing (10%) makes the development cost of a notional house of 85m2 to be £133,875.
Agricultural land in Yorkshire has been valued at £21,000 per hectare. At a density of 35 dwellings per hectare (dph) this is £600 per house. Adding a possibly generous £5,000 for the Community Infrastructure Levy (CIL), £140,000 should be subtracted from the sale price of a house to arrive at an estimate of planning gain. This gives
Planning gain = Selling price – £140,000
An indication of selling prices for new build green field 3 bedroomed houses with 85m2 of floor space may be made in comparison with the new Development in Derwenthorpe. A typical example (82m2) is now selling for £322,000. For a greenfield site, where little site remediation is required
Planning gain for one house = £322,000 – £140,000 = £182, 000
In making following calculations I have divided sites into greenfield sites and brownfield sites and use the percentages for affordable housing for greenfield (30%) and brownfield sites (20%). The following sites I have guessed as greenfield: st2, st4, st7, st8, st9, st14, st15, st31. The rest are brownfield.
Planning gain for greenfield sites
My estimates of planning gain for greenfield sites in the York Local Plan
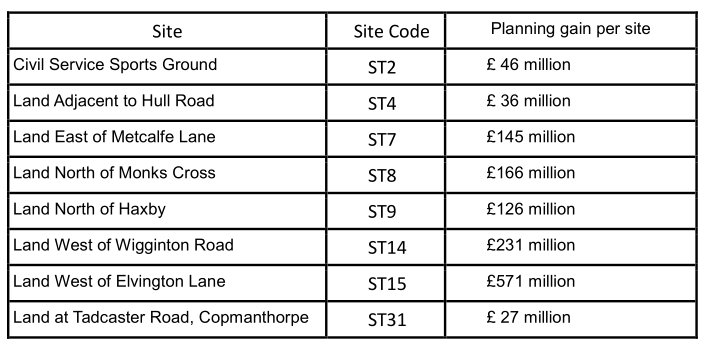
Total planning gain for greenfield sites is £1.34 billion for 7870 dwellings. In terms of the population of York, this equals over £16,000 for each of the 83,000 or so households in York.
Planning gain for brownfield sites
For brownfield sites I have assumed/guessed an average value of £4,000 per dwelling for site remediation. At a density of 50 dph this is £200,000 per hectare. On the more polluted sites such as York Central, densities are planned to be 100 dph allowing £400,000 per hectare for remediation.
This gives the total planning gain for brownfield sites as £1.20 billion for 7070 dwellings. This is over £14,000 for each of the 83,000 or so households in York.
Combined with the gain from greenfield developments, my estimate of total
planning gain in York is £2.55 billion equal to £30,000 for every household in York.
Affluent incomers to York exile the poor
PM3, Explanation of City of York Housing Needs (in [1], See above) uses the term ‘affordable housing’ implying concern for the less well off. However, In 2014, a Guardian article by Colin Wiles, Affordable housing does not mean what you think it means, commented:
In a move worthy of George Orwell’s Ministry of Truth, affordable rent will be higher than before, set at up to 80% of the local market rent. Across whole swathes of southern England affordable rented properties will simply not be affordable to people on low incomes.
Professor Mark Tewdyr-Jones caused a stir in the media by suggesting that York and three other northern cities should be now considered part of London. He said:
There are several ways you could define a northern region, but perhaps the most pertinent question is ‘where does London end?’
My map is a northern area defined as being ‘not London’, where London’s sphere of influence extends over most of the country, determined by two-hour commuting patterns to London, which is becoming the norm.
It is now possible to reach London from York Station in under two hours and when (or if) the HS2 rail project reaches York, it will be nearer 90 minutes. This makes York a very attractive place to move to for Londoners who want to keep connections with London but can cash in on the fact that in certain residential areas of London house prices are three or more times greater than those in York.
York Council’s Strategic Housing Market Assessment (SHMA), June 2016 says:
“House prices in York are expected to grow by 200% over the next 15 years (from 2016)”
The authors may have misread Table 2: Median House Price Change over different Periods in the SHMA which applies to past house price rises but 200% may be a reasonable guess for the next 15 years.
There is an attraction to living in York and having a comfortable train ride into the centre of London compared to travelling from an ordinary 3 bedroomed house in Bow for an hour on a crowded No 8 bus. There is an additional attraction of moving from an ordinary £1,000,000 house in Bow or similar parts of London to a large £500,000 house in York may be an added incentive for Londoners to move to the new London outpost, York.
Of course, all new residents of the proposed developments will not come from London, but there will be enough to raise house prices. Prices that will ensure that under present proposals the residents of the new developments will have to be affluent. Enhanced rail services, such as HS2, will cut the commuting time to London and could attract even more people to York.
Landowners and house owners benefit
Although land owners profit because of their planning premiums, the wider and more important effect is the overall rise in the cost of housing: Home owners see enormous increases in their property wealth, while others pay higher rents. This is an enormous transfer from the poor and the young who don’t own their homes to the old and the affluent who do. This will be driven by this local plan.
In Will the government restart plotlands, I reported some earlier demographic calculations:
Using the P2 demographic classification, I analysed house sales data for England and Wales for years 2000 and 2010.
Adjusting for inflation between 2000 and 2010, I found that property of the most affluent areas increased by just over eight times the 2010 average income. Property prices in the least affluent areas rose by a factor of two.
However, according to the 2011 census, only 20% of households in the least affluent areas own their homes. In the most affluent areas this rises to 90%.
Summary: House price inflation has given most households in the most affluent areas large increases in their net wealth, at the same time most households in the least affluent areas will have paid increased rents.
In York, this has the effect of forcing out the less affluent and their children. Even the children of the more affluent may have temporary difficulty – in the years before they inherit from their parents.
A similar story was outlined in a report by Ove Arup & Partners Ltd. For the City of York Council. The report, Housing Requirements in York, Assessment of the Evidence on Housing Requirements in York. The telling part of the report is in section 6.3 Broader relationships and impacts. I have added numbered headlines (in bold). Paragraphs from the Arup report are in green.
6.3 Broader relationships and impacts
- First time buyers cannot even afford lower priced houses
Although headline prices have remained in line with national trends in York, lower quartile priced housing has become less affordable suggesting that established home owners are probably compromising their choices at the lower end of the market, probably in homes that were previously available to first time buyers.
- Older, more affluent people will displace traditional population.
The consequences of such changes are complex but are likely to include the development of an increasing proportion of older, more affluent (and socially conservative) population over time. There will also be displacement of traditional population, perhaps to locations such as Selby or Leeds as gentrification becomes more widespread.
- Incomers from London and the South East will move to York because of lower house prices
However, perhaps more positively is that the city may become more
attractive for high skill groups, perhaps relocating from the higher house price areas of London and the South East. - These incomers cannot return to the South East
Relocation from such places is typically constrained by the assumption
that moving to a cheaper location means that it will never be possible to move back and that relocation may prove to be the “graveyard of
ambition” as in the future it could constrain future career choices. - High skilled people move in
For example, surveys suggest that the parity of house prices between say, Cambridge and London, has been a factor that improves the attractiveness of the city to the highest skill groups. To some extent Harrogate and the Wharfe Valleys, as a premium housing locations for the Leeds labour market also may be demonstrating this effect. The issue here concerns the type of role as a City that York wishes to play.
- Neighbouring local authorities may not help
York is located is a broader strategic housing market in which most
indicators suggest strong demand. There is thus no obvious sub area
options to disperse growth to neighbouring districts, indeed on the
contrary it is likely that York will face additional pressures both because surrounding districts may under provide for housing. Such pressure also arises because York is and is likely to remain the major source of employment and services in its sub region and York’s range and choice of housing is broader. - Higher house prices will cause commuting to increase
Whilst is possible, that market processes in terms of higher house prices may encourage a wider area of housing search, including most obviously Leeds (or perhaps Hull) this is likely to be associated by additional in commuting. There are opportunities for sustainable travel choices for commuters in the sub-area, including rail links from Malton and Selby and there is scope for a future, more planned, sub-regional approach.
This Local Plan will have the effect of exiling the poor by forcing up the cost of housing, a result of keeping the supply limited. The City of York Council Strategic Housing Market Assessment by GL Hearn Limited calculates the Objectively Assessed Need (OAN) which uses demographic analysis to arrive at a starting point for the number of dwellings to be included in the Local Plan. The report states:
Government’s Planning Practice Guidance sets out how the objectively
assessed need for housing should be defined. It sets out that the starting point should be demographic projections, with appropriate assumptions regarding household formation rates. The need may then need to be adjusted to support economic growth or improve affordability. The SHMA follows this approach to identifying housing need.
If the Government’s Planning Practice Guidance does mean affordable in its normal sense (rather than 80% of the local market rent) then the future housing targets outlined in the report are clearly insufficient because current market conditions have made housing in York unaffordable: This causes even those on reasonable incomes to move to Selby or further. As GL Hearn points out:
In travel to work terms York has a strong influence in the immediately
surrounding districts particularly Selby, the southern parts of Hambleton and the eastern parts of Ryedale and East Riding.
This plan does not consider the incomers from the rest of the country, particularly London, who will move to York because it is a pleasant place to live, work and retire. Many will still be linked economically to London, managing to continue their London jobs remotely but living in York.
My added headline No.4 on the Ove Arup report (above) “These incomers cannot return to the South East.” needs the addition and say:
“These incomers cannot return to the South East.
They will exile the poor from York
who will not be able to return to York.”
TrackBack URL :