
The York Local Plan: Climate Change
The York Local Plan: Climate Change
Submission to the Public Inquiry on the 2018 York Local Plan
Geoff Beacon, July 2019
Climate change
In September 2018, the Secretary General of the United Nations, António Guterres, delivered a warning [1]:
Dear friends of planet Earth,
Thank you for coming to the UN Headquarters today.
I have asked you here to sound the alarm.Climate change is the defining issue of our time – and we are at a defining moment.
We face a direct existential threat.
Climate change is moving faster than we are – and its speed has provoked a sonic boom SOS across our world.
If we do not change course by 2020, we risk missing the point where we can avoid runaway climate change, with disastrous consequences for people and all the natural systems that sustain us.
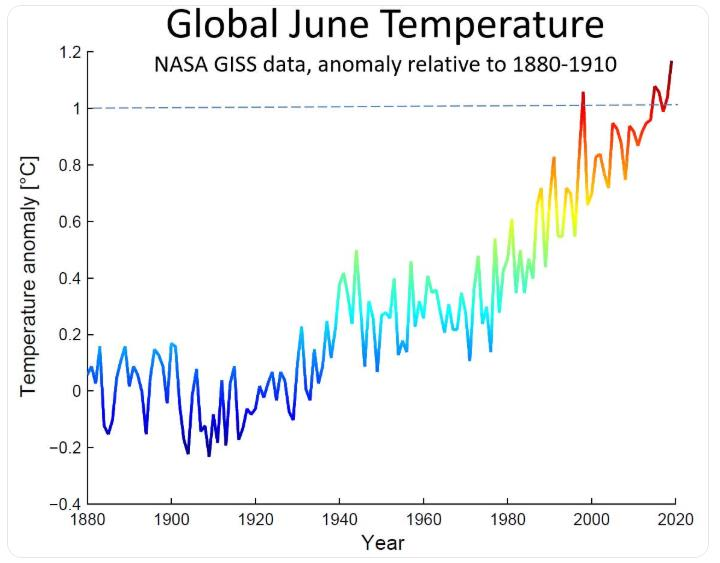
The latest global temperatures from NASA [2] add emphasis:
Measuring greenhouse gas emissions: Lack of consistency
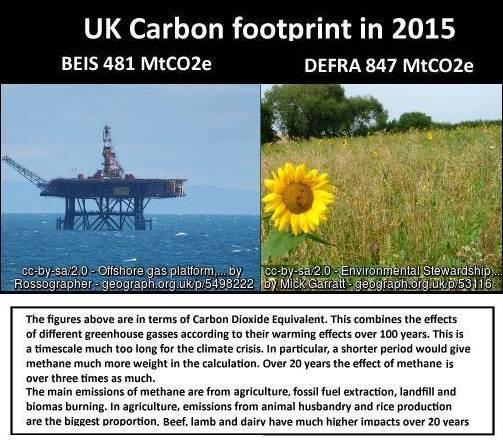
When UK’s emissions are measured using the method favoured by the Department of Business, Energy and Information Services (BEIS) the UK’s carbon emissions are shown to decrease substantially since 1990. However, this measure does not include emissions from international air travel, shipping and emissions overseas from creating goods imported to the UK. When a UK steel works shuts this measure decreases.
The Department of Environment, Food and Rural Affairs (DEFRA) measures UK emissions differently based on the emissions caused by UK consumption. This method, consumption accounting, includes the effects of air travel, shipping and imports. When a UK steel works shuts this measure likely increases because of transport emissions and the carbon efficiency of the production of imported steel may be less.
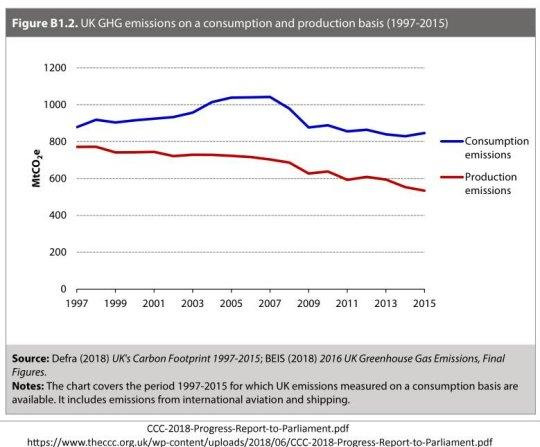
The results from production and consumption accounting are substantially different as shown in Figure 2.
Consumption accounting (from DEFRA) is the method relevant to local plans, which can help shape lifestyles and resulting consumption patterns. Local plans have much less influence on patterns of production.
Resolution 42/187 of the United Nations General Assembly
Resolution 42/187 of the United Nations General Assembly [4] says:
4. [The General Assembly agrees] further that an equitable sharing of the environmental costs and benefits of economic development between and within countries and between present and future generations is a key to achieving sustainable development;
Development can create large amounts of greenhouse gasses both in construction and enabling lifestyles with large emissions, at a time when the seriousness of climate change is being recognised as a fundamental threat to future generations. Large emissions are not consistent with UN Resolution 42/187.
Future generations and vulnerable populations
For future generations and vulnerable populations, the consequences of Climate Change could be bad, very bad. The Special Report by the IPCC on Global Warming of 1.5°C [5] says:
B.5 Climate-related risks to health, livelihoods, food security, water supply, human security, and economic growth are projected to increase with global warming of 1.5°C and increase further with 2°C.
Climate Change will disproportionately affect vulnerable populations and so affect environmental costs ‘between and within countries’:
B.5.1 Populations at disproportionately higher risk of adverse consequences with global warming of 1.5°C and beyond include disadvantaged and vulnerable populations, some indigenous peoples, and local communities dependent on agricultural or coastal livelihoods (high confidence).
Carbon dioxide equivalent (CO2e) and the remaining carbon budgets
Climate change is caused by emissions of greenhouse gasses from human activity. The most important greenhouse gas is carbon dioxide (CO2) but others, such as methane (CH4) and nitrous oxide (N2O), cause extra warming. To account for these other gasses a composite measure of the gasses a combined measure, Carbon Dioxide Equivalent (CO2e) is used.
Emissions of CO2 are often made without reference to these other gasses: It is often assumed in national statistics that when a given amount of CO2 is emitted it is accompanied by a proportional amount of other greenhouse gasses. Typically, this adds 30% to measures of CO2 alone: e.g. 1 tonne of CO2 is assumed to be accompanied by other greenhouse gasses to add up to 1.30 tonnes of CO2e.
Carbon budget for 1.5°
In the IPCC’s Table 2.2 of Mitigation Pathways Compatible with 1.5°C in the Context of Sustainable Development, [6] (SR15, 2018) the remaining carbon budget for a 66% chance of keeping below 1.5°C is given as 420 Gt CO2 from the beginning of 2018. (Gt means gigatons: a billion tonnes.) Subtracting the global CO2 emissions in 2018 of 42 Gt CO2 gives 378 Gt CO2 from the beginning of 2019.
For the period 1997 – 2016, DEFRA have produced figures for UK emissions [7] in both CO2 and CO2e. Over this period the emissions counted as CO2e are 30% higher than those counted as CO2 alone. This is nearly the same in a report by Carbon Market Watch on SR15 [4]. Using a 30% increase and an estimate of world population of 7.7 billion gives Table 1. This shows a remaining carbon budget, with a 66% chance of remaining under a 1.5°C rise in global temperature to be 64 tonnes CO2e per person.
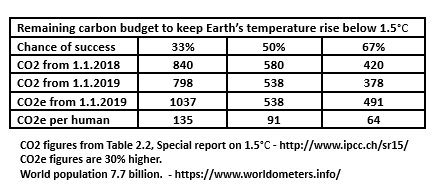
This estimate of 64 tonnes CO2e can be taken as a baseline personal remaining carbon budget for a 1.5°C increase in average global surface temperature. Such a rise is regarded as the threshold of dangerous climate.
To fulfil the requirement of UN 42/187 for “equitable sharing of the environmental costs” “between present and future generations” means the greenhouse gas emissions of individual lifestyles should not greatly exceed the baseline personal remaining carbon budget of 64 tonnes of CO2e.
Global carbon emissions until carbon neutral is reached by 2050
Reaching zero carbon emissions by 2050 is a target sometimes attributed to the Carbon Neutrality Coalition [8] of countries.
Global fossil fuel emissions of CO2 in 2018 were projected to be 37.1 Gt CO2 by the Global Carbon Project [9], with a further 5.1 Gt CO2 due to changes in land use – a total of 42.2 Gt CO2. Adding 30% to this figure to incorporate the effects of non-CO2 greenhouse gasses gives 54.9 Gt CO2e.That is an average of 7.1 tonnes of carbon dioxide equivalent per year for every person currently on Earth: 7.7 billion.
Suppose that global greenhouse gas emissions were to fall by an equal amount every year to reach net zero in 2050. Current global emissions average 7.1 tonnes CO2e per capita. If they fell evenly from now until 2050, the total emissions per capita would be 111 tonnes CO2e per capita (111 = 7.1*31/2).
Falling by equal amounts every year until 2050 is an optimistic target given past performance but even this exceeds the remaining carbon budget for 1.5°C by 73%. Even under this optimistic scenario, current generations are being inequitable to future generations. To avoid a rise of 1.5°C in global mean surface temperature, immediate reductions in the emissions of greenhouse gasses are required – much greater than a steady fall by equal amounts until 2050.
UK emissions
The UK government has also pledged that the UK becomes carbon neutral by 2050.
In UK’s Carbon Footprint 1997 – 2015 [6], DEFRA estimated that in 2015 UK greenhouse gas emissions were 847 million tonnes of CO2e. That is 13 tonnes CO2e per capita. If there were a steady fall until 2050, these emissions would total 202 tonnes CO2e per capita, (202 = 13*31/2) exceeding the baseline personal remaining budget by 3.3 times.
Greenhouse gas emissions from the UK’s power sector have been falling from 1990, by phasing out coal and increasing input from gas and renewables. However, the UK’s carbon footprint, measured on a consumption basis is hardly falling.
Embodied carbon in buildings
Finding a reliable source of the quantity of greenhouse gasses caused by the construction of buildings is difficult. However, it is clear that the construction industry is responsible for large emissions, mostly due to their use of raw materials. These become the ’embodied carbon’ in buildings and other structures.
Awareness of embodied carbon in building is low and, there is resistance to acknowledge the issue despite the work of the Royal Institute of Chartered Surveyors. [10]
One of the best available assessments of embodied carbon in building was published by Bioregional. This looked at the construction of BedZED, the Beddington Zero Energy Development, “the UK’s first large-scale, mixed-use sustainable community comprises 100 homes, office space, a college and community facilities”.
In BedZED: Toolkit Part I [11], it says
The total embodied CO2 of BedZED is 675kg/m2 , whilst typical volume house builders build to 600-800kg/m2 . Despite the increased quantities of construction materials, the procurement of local, low impact materials has reduced the embodied impact of the scheme by 20-30%.
Without the “procurement of local, low impact materials”, such as locally available recycled steel, the total embodied CO2 of BedZED would be more than 800kg CO2/m2. This would mean that the embodied carbon for a 100 m2 dwelling will be over 80 tonnes CO2. (As the main greenhouse gas emissions from construction are in the form of CO2, it may be plausible to convert this to 80 tonnes CO2e without addition.)
Another assessment of embodied carbon in building comes from Mike Berners-Lee. In How bad are bananas [12], he reports an assessment of “a brand-new cottage with two bedrooms upstairs and two receptions rooms and a kitchen downstairs”. The result of the assessment gave a figure of 80 tonnes CO2e for the dwelling. These figures are appropriate to housing constructed from traditional materials, bricks, mortar, glass and steel.
For a conventional house, a 3 bed semi, I have received an estimate of embodied carbon from Bob Hill using the methodology of the Royal Institute of Chartered Surveyors. This arrived at a figure of 92.38 tonnes CO2 for a 100m2 semi-detached house. It included the pavement and half the road outside but made no allowance for constructing a garage.
Emissions from cars
The carbon emissions from making a new car are large, Mike Berners Lee of Small World Consulting estimates that to manufacture a medium spec Ford Mondeo creates 17 tonnes of CO2e. The emissions for driving a car for 11,481 kilometres a year (a typical distance in the UK) for 13.9 years, (the average lifetime of a car in the UK [23]) is given in the following table.
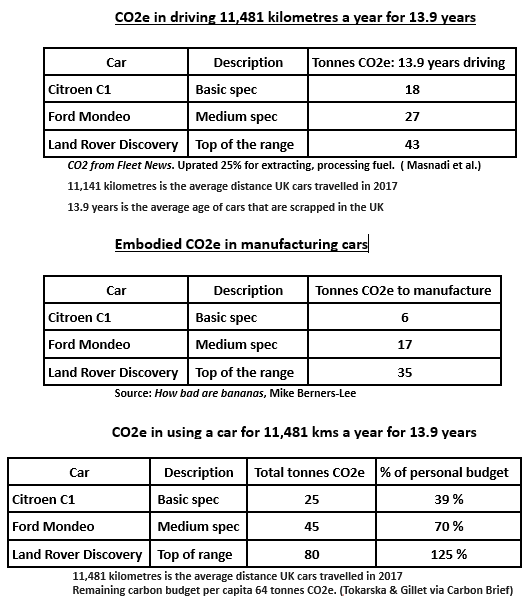
Many motorists cannot fit within a remaining carbon budget of 64 tonnes CO2e simply from the use of their cars. If these levels of emissions continue into the lifetime of a second car none will.
Will electric cars come to the rescue? In the crucial period for global emissions, the next decade or so, the electricity that powers them will not be sufficiently decarbonised. In addition, the embodied carbon in electric cars is larger than cars powered by fossil fuels. See the video by Bjorn Lomborg, Do electric cars really help the environment? [15]
Wealthy residents are high carbon
In general, the affluent have higher carbon footprints than the poor. In a publication commissioned by the Joseph Rowntree Foundation (JRF), Distribution of Carbon Emissions in the UK: Implications for Domestic Energy Policy [14], the Centre for Sustainable Energy looked at the emissions of CO2 by ten different income groups from the 10% with lowest income to the 10% with highest income. They analysed the emissions from household fuels, cars, public transport and international aviation. The following table uses the data from their Figure 10 to compare the income brackets for the lowest 20% of income with the highest 20%.
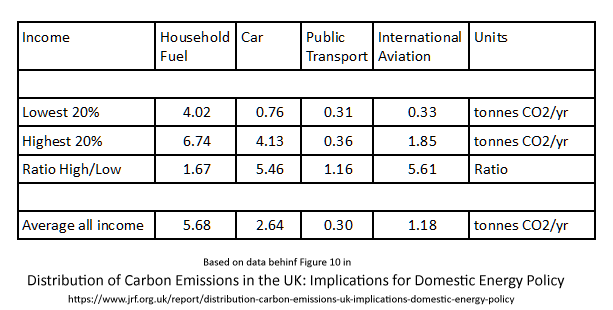
In this table there are things to note:
P1) Household fuel was the largest source of emissions. That was mostly heating homes. The top 20% caused 67% more emissions, probably because they lived in bigger homes and had more money to spend on heating. As homes become better insulated and electricity is decarbonised, the carbon emissions from household fuel are expected to fall substantially.
P2) The emissions from cars was on average much greater than public transport or international aviation. These emissions are over five times higher in the top 20% of income compared to the lowest.
P3) The emissions from public transport are much smaller and do not vary greatly between income bands.
P4) The emissions from international air flights are significant: Large for those with higher incomes but small for those with low incomes.
The York Local Plan
This section of my submission will concentrate on the residential aspect of the York Local Plan and
its consequences for climate change.
The National Planning Policy Framework
The National Planning Policy Framework (July 2018) [3] (NPPF) says in section 2, Achieving sustainable development, paragraph 7:
The purpose of the planning system is to contribute to the achievement of sustainable development. At a very high level, the objective of sustainable development can be summarised as meeting the needs of the present without compromising the ability of future generations to meet their own needs (Note 4) .
Note 4 refers to Resolution 42/187 of the United Nations General Assembly [4] as discussed above.
The proposed York Local Plan will create high emissions of greenhouse gasses in building construction and enable high-carbon lifestyles. The plan is contrary to the National Planning Policy Framework which demands an equitable sharing of environmental costs between present and future generations.
York’s Sustainability Appraisal
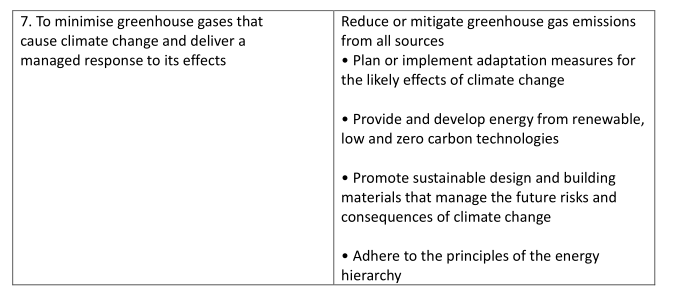
In June 2019, Wood Environment & Infrastructure Solutions UK Limited updated their Sustainability Appraisal Report Addendum for City of York Local Plan. This appraisal considered several aspects of sustainability including Objective 7, “To minimise greenhouse gases that cause climate change and deliver a managed response to its effects”. Entry 7 in Table 2.1 SA Framework is:
Later in Table 5.4 Updated results of the cumulative effects assessment, the row 7. climate change has a column for housing. It is marked “0/-“ meaning housing policies in the York Local Plan have either ”No significant effect / no clear link between the policy and the SA objective” or “The policy is likely to have a negative effect on the SA objective”. In short, Wood Environmental are saying that housing policies in the York Local Plan are bad for climate change.
Embodied carbon in buildings
To get some idea of the scale of embodied carbon in dwellings in the York Local Plan, assume a conservative figure of 70 tonnes CO2e per dwelling. On the assumption that one dwelling has the UK average of 2.4 residents, the carbon emissions created by providing housing for one resident works out at 29 tonnes CO2e per resident. This is a very large proportion of a personal remaining carbon budget of 64 tonnes CO2e.
Under the list of objectives in the Sustainability Appraisal Report Addendum, it says:
Promote sustainable design and building materials that manage the future risks and consequences of climate change.
Such ‘promotion’ has not affected the construction of recent developments in York, like at Hungate and Derwenthorpe, where high carbon elements like concrete slabs, structural steel and brickwork have been clearly visible. In planning processes in York, there seems little real consideration of embodied carbon.
Some housebuilders claim that using different methods of construction, enough carbon can be stored in buildings so that the embodied carbon is negative (i.e. The construction process, including materials, has the net effect of extracting CO2 from the atmosphere.) Two sample approaches are provided by UK Hempcrete and Baufritz. Baufriz have actually claimed that the embodied CO2 in one of their buildings can store the equivalent 50 tonnes of CO2. Such claims should be examined closely. However, it is almost certain that some form of building is possible that will extract CO2 from the atmosphere as a result of its construction.
I have had considerable correspondence on this issue over the past decade. This includes BRE Limited, Bioregional, The Inventory of Carbon and Energy (ICE), The Association for Environment Conscious Building, Department of Trade and Industry, The Department for Communities and Local Government and York Council.
Sadly, awareness of the issue of embodied carbon in building is small and, I have detected resistance to acknowledge the issue despite the good work by the Royal Institute of Chartered Surveyors.
The York Local Plan should require that buildings should set a limit on the carbon emissions caused by building construction. If possible, building structure should store carbon.
The York Local Plan will attract wealthy residents
Professor Mark Tewdyr-Jones caused a stir in the media by suggesting that York and three other northern cities should be now considered part of London [13]. He said:
There are several ways you could define a northern region, but perhaps the most pertinent question is ‘where does London end?’
My map is a northern area defined as being ‘not London’, where London’s sphere of influence extends over most of the country, determined by two-hour commuting patterns to London, which is becoming the norm.
It is now possible to reach London from York Station in under two hours and when (or if) the HS2 rail project reaches York, it will be nearer 90 minutes. This makes York a very attractive place for Londoners, who want to keep connections with London but can cash in on the fact that in certain residential areas of London house prices are three or more times greater than those in York.
The relevance of affluent people moving to York in the York Local Plan is that affluent people have higher carbon footprints than the less affluent. Much of the proposed housing will be such that they are encouraged in their high carbon lifestyles.
The effect of the York Local Plan will be to enable high carbon lifestyles.
It should be rethought
Derwenthorpe, a ‘sustainable’ development
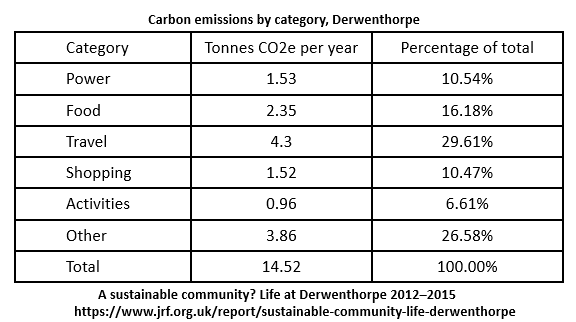
An example of the likely carbon footprints of the residents of the new greenfield dwellings in the York Local Plan, is the “sustainable” development at Derwenthorpe by the Joseph Rowntree Housing Trust. The related Joseph Rowntree Foundation commissioned a report to assess the environmental sustainability of Dewenthorpe residents. The study, A sustainable community? Life at Derwenthorpe 2012–2015 [16] was produced by the Centre for Housing Policy and the Stockholm Environment Institute at the University of York. The study reported the carbon footprints of residents of Derwenthorpe using the REAP petite assessment method [17]. It reported:
Derwenthorpe carbon footprints were lower than the UK mean (at 14.52 tonnes compared with 16.24 tonnes per year).
The estimated carbon emissions of the residents of Derwenthorpe mean they reach the budget of 64 tonnes CO2e within five years. The report also noted that residents of Derwenthorpe had higher carbon footprints than the average for York (14.52 as opposed to York’s 14.30 tonnes CO2e per year).
Broken down into categories the footprints given were:
The “learning points” of the research found that “Households’ home energy footprints are easier for developers to influence than transport footprints.”
For new buildings, developers can insulate buildings to a high standard and provide other energy saving measures, such as ground source heat-pumps, but it is much harder to influence the transport footprints of those households, which have cars.
The Derwenthorpe development has been billed as ‘sustainable’. It is not.
When developments are claimed to be ‘sustainable’
they should be thoroughly examined.
Car-free development: The only plausible future
In Derwenthorpe, there is one parking space per dwelling.
Table 16: Individual footprints… of Life at Derwenthorpe shows the results for 40 residents, only one of which was in a household without a car. This resident had the lowest carbon footprint at 8.12 tonnes CO2e/year, compared to an average of 14.52 tonnes. The maximum footprint was measured at 30.82 tonnes CO2e per year.
These estimates for Derwenthorpe included a fixed figure, ‘other’, of 3.86 tonnes of CO2e/year as a standard amount applied to all UK measurements. This is based on the individual share of emissions associated with government spending on hospitals, roads etc. This is not under the control of residents and cannot be influenced by the York Local Plan.
The rest of the footprint may be regarded as ‘voluntary’ i.e. It is the behaviour of the residents that generate that part of the footprint. Without the ‘involuntary’ addition, the carbon footprints for the respondents would be: lowest 4.26; mean 10.66; maximum 26.96 tonnes CO2e/year. The household with the smallest footprint was the only one without a car.
The minimum ‘voluntary’ footprint of the car-free resident was 40% of the average ‘voluntary footprint’ and 16% of the maximum. That resident is car-free and (relatively) low-carbon. To comply with the requirements of the NPPF, new developments should be low-carbon and keep within remaining carbon budgets.
Residential developments in the York Local Plan must be car-free.
A further conclusion
The situation is so serious that flying in planes, eating beef or regularly travelling in private cars, are contrary to Resolution 42/187. A local plan cannot easily affect holiday flights or diet but in making provision for a high level of car ownership and the polluting lifestyles that go with it, the current version of the local plan is contrary to UN Resolution 42/187 and so contrary to the new NPPF.
Postscript: Climate feedbacks
There are feedbacks within the climate system not yet counted in climate models. Nearly all of these exacerbate the problem of climate change. They make the excessive greenhouse gas emissions which would be caused by the York Local Plan more worrying. I have had personal experience of how these have been omitted from the predictions of climate science:
In 2012, I was raising this issue of climate feedbacks through my MP. The Parliamentary Office of Science and Technology responded:
The general consensus was that at the present time the evidence base is insufficient for a POSTnote to be undertaken and any briefing would end up simply calling for more research to fill the information gaps, which is something we generally try to avoid as it isn’t that informative for policymakers.
In 2014, the Parliamentary Office of Science and Technology produced POSTnote 454, Risks from Climate Feedbacks [19]. This concluded:
Compared to existing model estimates, it is likely that climate feedbacks will result in additional carbon in the atmosphere and additional warming. This is because the majority of poorly represented climate feedbacks are likely to be amplifying feedbacks. This additional atmospheric carbon from climate feedbacks could make it more difficult to avoid a greater than 2˚C rise in global temperatures without additional reductions in greenhouse gas emissions. The strength of many amplifying feedbacks is likely to increase with warming, which could increase the risk of the climate changing state (Box 3). Some commentators suggest the uncertainties in our knowledge of carbon cycle and physical feedbacks may mean the Earth will warm faster than models currently estimate.
In 2016, scientists at the Department of Energy and Climate Change replied to me [20] concerning positive feedbacks:
1. Am I correct in thinking that some of these feedbacks were not used in the models that calculated the “remaining carbon budgets” – as used in the IPCC AR5?
“That’s correct, the models used vary in what they include, and some feedbacks are absent as the understanding and modelling of these is not yet advanced enough to include. From those you raise, this applies to melting permafrost emissions, forest fires and wetlands decomposition.”
2. Are there other missing feedbacks that should be considered?
“The feedbacks you mention are certainly important, although there are several other feedbacks that could be included but are currently too difficult to model. As knowledge and understanding advances, they will be added to the climate models.”
Permafrost emissions, forest fires and wetlands decomposition were not counted and “there are several other feedbacks that could be included”.
In 2019, these feedbacks are still not be properly incorporated in climate models – although some like the wildfires (now even in the Arctic) are now newsworthy. More worryingly, scientists are beginning to look at “cascading tipping points” as described in the video by Paul Beckwith [21].
Hyperlinks to references
- [1] https://www.un.org/sg/en/content/sg/statement/2018-09-10/secretary-generals-remarks-climate-change-delivered
- [2] https://twitter.com/rahmstorf/status/1150826482555637762
- [3] https://www.gov.uk/government/news/governments-new-planning-rulebook-to-deliver-more-quality-well-designed-homes
- [4] http://www.un.org/documents/ga/res/42/ares42-187.htm
- [5] https://www.ipcc.ch/site/assets/uploads/sites/2/2019/02/SR15_Chapter2_Low_Res.pdf
- [6] https://assets.publishing.service.gov.uk/government/uploads/system/uploads/attachment_data/file/794557/Consumption_emissions_April19.pdf
- [7] https://carbonmarketwatch.org/2018/10/08/new-ipcc-report-shows-1-5c-is-still-possible-but-more-needed-from-aviation-and-shipping/
- [8] https://www.carbon-neutrality.global/high-level-inaugural-event-of-the-carbon-neutrality-coalition/
- [9] https://www.globalcarbonproject.org/carbonbudget/index.htm
- [10] http://www.rics.org/uk/knowledge/professional-guidance/professional-statements/whole-life-carbon-assessment-for-the-built-environment-1st-edition/
- [11] https://www.bioregional.com/wp-content/uploads/2014/11/BedZED_toolkit_part_1.pdf
- [12] https://profilebooks.com/how-bad-are-bananas.html
- [13] https://www.thetimes.co.uk/article/leeds-isn-t-in-the-north-says-academic-it-s-in-london-b6l0cgtcw
- [14] https://www.jrf.org.uk/report/distribution-carbon-emissions-uk-implications-domestic-energy-policy
- [15] https://www.youtube.com/watch?v=17xh_VRrnMU
- [16] https://www.jrf.org.uk/report/sustainable-community-life-derwenthorpe
- [17] http://www.reap-petite.com/
- [18] https://www.brusselsblog.co.uk/york-central-a-climate-disaster/
- [19] https://researchbriefings.parliament.uk/ResearchBriefing/Summary/POST-PN-454
- [20] https://www.brusselsblog.co.uk/carbon-budgets-a-straightforward-answer-from-decc/
- [21] https://youtu.be/G25dGJ3yUYk
- [22] http://eprints.whiterose.ac.uk/79131/14/Carbon Reduction and Travel Bahviour – Discourses, Disputes and Contradictions in Governance.pdf
- [23] https://www.smmt.co.uk/industry-topics/sustainability/average-vehicle-age/
TrackBack URL :