
Oxford Economics 1: Robots and climate
I heard the news today on BBC, ITV [1] and followed up online [2].
One interesting story concerned a report by Oxford Economics [3] about how every new industrial robot would destroy 2.2 jobs in poor areas and 1.3 jobs in wealthier areas. Apparently, this will be countered by the increased economic growth that these robots will bring.
However reports in the media did not mention the effects of economic growth on climate change so perhaps Oxford Economics should do some more research.
A start would be to look at the global yearly emissions of CO2 and also at the Keeling Curve showing increased CO2 concentrations in the atmosphere:
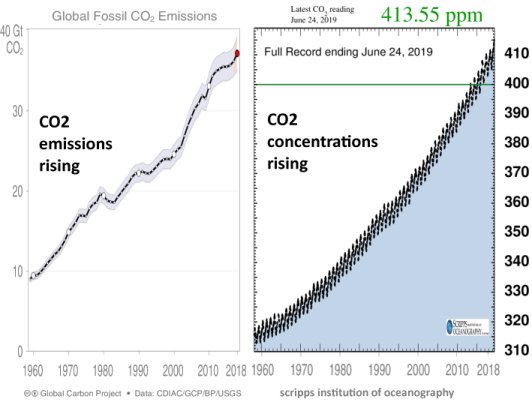
Emissions from human activity cause a rise in the atmospheric concentrations which in turn cause the Earth to heat with many nasty consequences: floods, droughts, heatwaves, hurricanes,& etc.
Before assuming that economic growth – increased GDP – is a one-way benefit, Oxford Economics should also look at this relationship between world GDP and CO2 emissions:
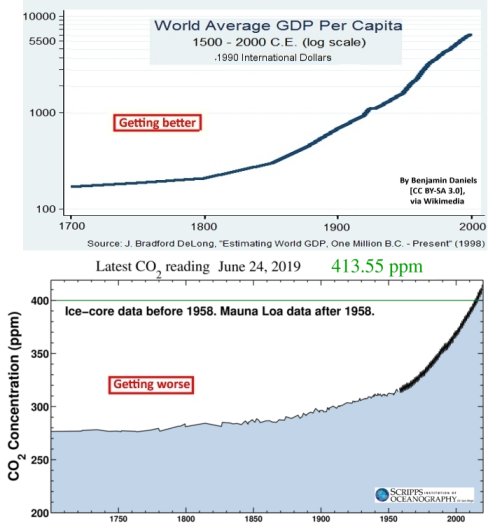
The production and consumption that is measured by GDP is causing the rise in CO2 concentrations in the atmosphere and the disasters that follow.
The world’s CO2 emissions can be expressed as a product of world GDP and the global emissions intensity [4][5]:
CO2 Emissions = World GDP * Global CO2 Emissions Intensity
This formulation means that, taken separately, an increase in World GDP of 1% causes an increase of CO2 of 1% and a decrease in global emissions intensity of 1% decreases CO2 emissions by 1%. If these 1% changes happen at the same time, emissions stay the same.
The change in CO2 emissions is a balance between economic growth, which pushes emissions up, and decreases in CO2 intensity, which pushes emissions down.
On the good side, global emissions intensity had been falling steadily over the past few decades, depressing CO2 emissions:
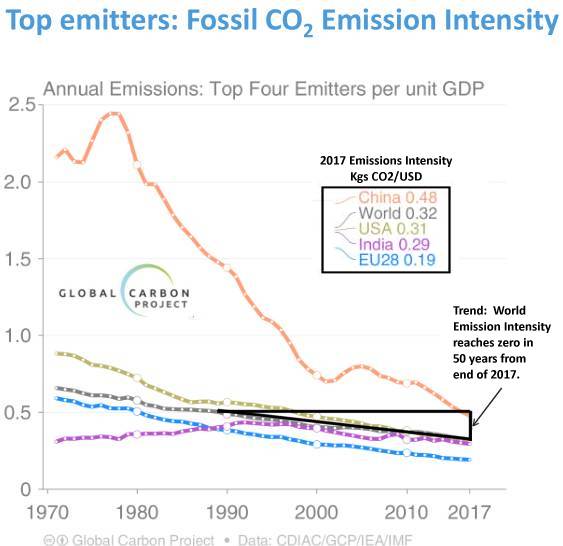
For more than 30 years, decreasing emissions intensity has followed a linear trend of roughly 2% of its value in 2017. If this trend continued, it will reach zero in about 50 years. If world GDP stayed at this value, the CO2 emissions would also decrease to zero in 50 years. [5a]
The bad news is that this adds up to a total over 1000 billion tonnes of CO2 [6]. This exceeds the target mentioned in the Paris Agreement of the Earth staying below a 1.5°C rise in temperature [7][8]:
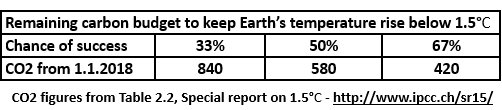
This is bad news. Unless emissions intensity can be decreased much quicker than the 2% of recent history, then World GDP must decrease to be compatible with the aims of the Paris agreement.
The report from Oxford Economics does not acknowledge any climate constraints. Further analysis would be welcome.
Can Oxford Economics show that economic growth is compatible with climate targets?
[1] Breakfast, BBC, Good Morning Britain ITV, Today BBC R4
[2] Web stories:
BBC, Robots ‘to replace up to 20 million factory jobs’ by 2030
CNN, Robots could take 20 million manufacturing jobs by 2030
Rappler, Robots to take 20M jobs, worsening inequality
Guardian, Rapid robot rollout risks UK workers being left behind
[3] I am not a client of Oxford economics so have not seen the actual report.
[3 extra] I have discovered that the report is available free of charge from Oxford Economics. They have kindly sent me a copy. I have looked at the report. This footnote is the only change I have made.
[4] Emissions intensity is the level of GHG emissions per unit of economic activity, usually measured at the national level as GDP. In this post, only CO2 emissions are included.
[5] This is a simplification of the Kaya Identity.
[5a] For more than 30 years, the GCP graph shows global emissions intensity falling more or less linearly at a rate equal to 2% of the 2017 value (i.e at a rate of 0.064 kgs/USD/year). The continuation of this linear fall means reaching zero in 50 years. During this time the yearly percentage fall increases. In the last year, global emissions intensity falls by 100% – from 0.064 kgs/USD to zero.
[6] In 2017 emissions were just over 40 billion tonnes CO2/year (including land use changes) If these fell ate the historic rate of improvement of emissions intensity each year for 50 years, the total emissions would just exceed 1000 billion tonnes CO2e.
[7] This is a rise of global mean temperature since pre-industrial times.
[8] These estimates do not include missing feedbacks. These make the CO2 budgets smaller and the situation worse.
Postscript 03 July 2019:
Linear or exponential model?
The linear fall in the intensity of emissions assumed above means that emissions are halved in the penultimate year from 4% of the 2017 (0.128 Kgs CO2/USD) level to 2%(0.064 Kgs CO2/USD) and to zero in the final year 2067.The reason for choosing a linear model is that (informally) that looks like the pattern of the previous 30+ years.
Another possibility is to use an exponential model of Emissions Intensity with it falling but a fixed percentage every year. This has the disadvantage it does not reach zero in a finite time. That seems implausible given the look of the graph.
Note that an exponential decay of 4.5% just keeps within 1000 Gt CO2 of emissions in 50 years.
The next post, Models of Mitigation, will discuss this further.
TrackBack URL :