
NoCars.org.uk
This post was the contents of NoCars.org.uk (now retired)
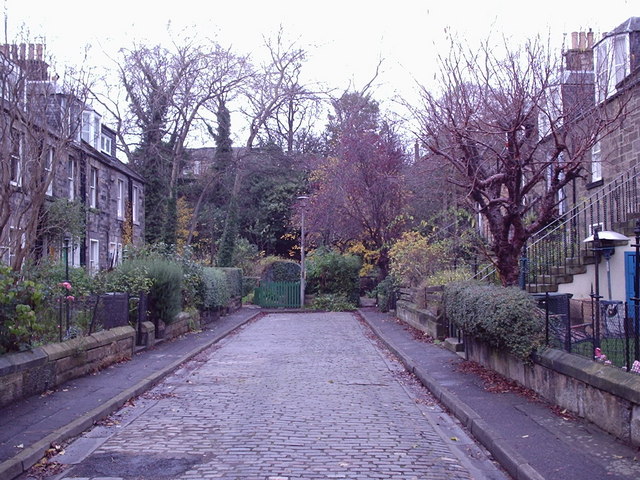
“Stockbridge Colonies with no cars – geograph.org.uk – 1432977” by Peter Rowan.
Licensed under CC BY-SA 2.0 via Wikimedia Commons
A waste of space
21st September, 2009
Climate change is the most urgent reason for drastically reducing motoring but there are many others. Top of the list is the space they waste. Here’s a blast from 1973:
The problem is that of designing an environment for people, who occupy a few square feet and need tens of square feet to move, which can also accommodate a large number of motor cars, which occupy hundreds of square feet and need thousands of square feet to move. This has consequences for housing design and for urban form. There are also other characteristics of motor cars which damage the local environment so that a large number of them in an urban setting has the effect of encouraging people to spread out spatially in trying to avoid the nuisances of heavy traffic.
Put simply, the choice is between compact no-car Venice and sprawling all-car Los Angeles.
Which do you choose?
Comment by James, January 5th, 2011
That’s easy, I choose Venice
Comment by Luke, May 23rd, 2011
I’m more of an LA man myself
Comment by Geoff, March 14th, 2013
Excellent video Car Free Venice.
Postscript July 2015: Carbon emissions from making cars
A report by Climate Central, Roadmap to Climate-Friendly Cars: 2013, concludes
Our state-by-state analysis reveals that because the manufacturing of an electric car causes more greenhouse gas emissions than manufacturing a comparable gasoline-powered car, an electric car must be driven sufficiently long distances using sufficiently low-carbon electricity for it to have lower total lifecycle greenhouse gas emissions than the gasoline-fueled car.
They give carbon emissions from the manufacture of different types of car as (converted to metric tonnes CO2e):
Electric Car 12.3
Gas Car 7.4
Hybrid Car 7.1
The UK Climate Change Act of 2008 aims to cut greenhouse gas emissions by 80% by 2050 to approximately 2.5 tonnes CO2e per year. At these estimates the emissions from the manufacture of an electric car are 5 years of this total budget.
Postscript January 2016: Carbon emissions from driving a car in a year
Tail pipe emissions from the SMMT for new cars in 2015 (including VW?) uprated a bit to 160 gm CO2/km – because published figures only account for measured tail-pipe emissions. They do not include emissions in processing and transporting oil. Average distance per year is taken as 12,700 km
This makes just over 2 tonnes per year or 80% of the 2.5 tonnes per year the Climate Change Act of 2008 is aiming at for 2050.
Postscript September 2017: Carbon emissions from driving an electric car in Maryland, USA
The Roadmap to Climate-Friendly Cars: 2013, gives the emissions from an all electric car, the State-by-state driving emissions of the Nissan Leaf. In the middle of the table, in the State of Maryland, the all-electric Nissan Leaf causes 133gm of CO2e per kilometre (0.47 gm/mile). Average distance driven in the Maryland per year was 9,474 miles in 2014.
Driving Maryland’s average distance using electricity from Maryland’s electric grid in a Nissan Leaf electric car creates approximately 2.03 tonnes of CO2e.
In some US states grid electricity is much lower in carbon emissions. This is where electricity is supplied by a mixture of wind and solar power, hydroelectricity and nuclear power. Most electricity used in Vermont is from these sources. For this reason The Roadmap could estimate that emissions from driving a Nissan Leaf in Vermont creates less than 5 gm CO2e per kilometre. However, it was still reporting that the carbon emissions in making electric car was 12.3 tonnes CO2e.
Postscript December 2020: A note from 1971: Highway Robbery
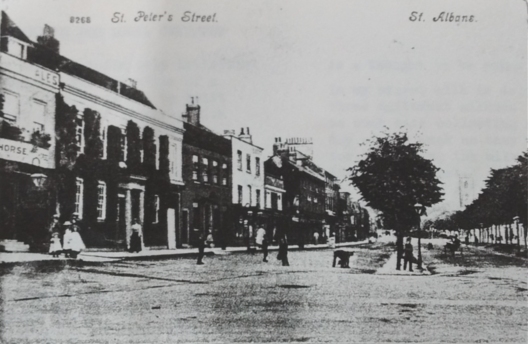
Once upon a time children used to play in the streets. outside their homes, cycle clubs would go out for a spin in the country at the weekend and people would walk around or stop and talk in the city centre streets or their local high street. Now traffic has taken most of the space that was used for these activities. It has in fact, completely taken over the major supply of easily accessible land – the public highway.
It is this gradual and largely unnoticed take over of land, which had perfectly good uses, that has hidden one of the main disadvantages of mass transport by the private motor car, this being the large amounts of space required to support such a mode of travel.
After this land grab, modern town planers are setting aside areas which can act for the displaced activities: On the housing estates they are providing “minor open space”; in the countryside, national parks; in the city, the shopping precinct. But it isn’t quite the same.
Minor open space is often the land left over after the houses and roads have been placed and, because of its self-consiousness, fails to develop the rich activity pattern of the old-fashioned street; national parks are great distances from the town and shopping precincts are expensive, partly because they have to pay dear to replace the land that has been taken over.
What, then, is the true land take for mass private car transport? I know of no really detailed work that has. tried to fully answer this question but, some work has provided material which will help to answer it.
In 1968 the Urban Planning Directorate of the Ministry of Housing
and Local Government analysed the amount of land required for
the motor car on estates that provided for the separation of cars and
pedestrians.
They found, taking the average of eight medium density estates that in providing space for 1.25 cars per dwelling (one car to 3.8 people) the land required. per dwelling was as follows:
| Space taken by | Area sq.ft. | % Area |
| – | ||
| Car in motion | 380.7 | |
| Car at rest | 297.0 | |
| – | ||
| Total car space | 677.7 | 26% |
| Gardens | 679.5 | 26% |
| Dwellings | 567.0 | 22% |
| Minor open space | 704.7 | 27% |
Minor open space: play space, footpaths and etc.
So the land on the estates is roughly one part each for houses, gardens, open space• and car space.
There are three main reasons why this land take is even worse than it appears:
- Firstly, unlike the land taken for houses or gardens, the car space must be continuously connected and, so presents many barriers to direct pedestrian movement;
- Secondly motoring, is a dangerous activity which must not be approached too closely (especially by children);
- Thirdly in the schemes studied the density of cars is not as high as it might be (The density of the dwellings was only medium (80 bed spaces per acre) and the level of car ownership that is regarded as saturation point by the Road Research Laboratory is almost twice the average of the schemes studied.)
One of the injustices of present government policy is that it only encourages estates which have facilities for at least one car per dwelling. This leaves non-motorists in an under-privileged situation because they have nowhere to live which is designed to meet their needs
Instead, they must live somewhere where they must share the cost of providing for the motor car and must pay for the roads on the estate, the extra cost of providing mains services and probably even garage. They must also suffer the danger and nuisance caused by the motor ear and must, do without the services generated by pedestrians, such as good public transport.
At his inaugural address at University College, London, Professor Smeed, gave a paper on the problems of Urban Congestion. He gave the following estimate of the area that peak hour commuters need for their cars while they are actually on the road:
| Speed in m.p.h. | Effective area of carriageway per car equivalent present in. sq• ft |
| 20 | 7,250 – 14,500 |
| 15 | 2,250 – 4,500 |
| 10 | 1,030 – 2,100 |
Road networks are now being extended to maintain (and in some cases increase) the speed of the increasing volume of traffic during the peak hour. This means that each extra peak hour motorist will take at least the following areas of city road for each minute actually on the road.
| Speed in m.p.h. | Area per minute on road in sq. ft. |
| 20 | 121 |
| 15 | 38 |
| 10 | 18 |
So if roads are built to keep traffic moving at a speed of, say, 15m.p.h. during the peak hour, an extra commuter traveling three miles to work in the city centre will need an extra 450 sq.ft. of road. The commuter will need an extra 250 sq.ft of road for a surface car park or 50 sq.ft. for a multi-storey car park.
The main reason for worrying about these large amounts of land is not that we are desperately short of land in this country, but because the land taken is the most accessible land where our children should be playing and where we should be meeting our neighbours. Let’s make public highway really public again.
TrackBack URL :