
Climate destruction 2: Rowntree policy
Summary from Part 1
- Consumption causes greenhouse gas emissions
- Greenhouse gas emissions cause climate change
- Climate change means consumption must be reduced
- The affluent consume far more than the poor
- The affluent must reduce their enormous consumption
- The poor should be supported
The Joseph Rowntree Foundation ‘solving UK poverty’
The Joseph Rowntree Foundation (JRF) wants to solve poverty in the UK. Their hashtag is #solveukpoverty.
Their 2016 report, UK poverty: Causes, costs and solutions, is a substantial report with over 50 participants in its four year development – and it lists 1159 references. Under the heading ‘Our vision of a poverty-free UK‘ the introduction says:
[I]n the 21 st century UK it is possible to ensure that, within a generation:
• no one is ever destitute
• less than one in ten are in poverty at any one time
• nobody is in poverty for more than two years.
There are many recommendations in this report, some summarised in its conclusion:
We can solve poverty by strengthening family life, ensuring all citizens have the skills they need to operate in the 21st century, fixing flaws in the benefits system, taking practical action to contain rising costs, and moving to more progressive employment and business practices.
Solving poverty relies on economic growth, but the proceeds need to be distributed more fairly, and the underlying causes, such as low pay, low skills and high costs, need to be reduced.
Some of the report’s recommendations to help the poor:
1. Lower the cost of living by
- reducing energy bills by collective switching
- making public transport work for the poor
- promoting lending through credit unions
- increasing the delivery of affordable homes
2. Tackle child poverty by
- educational funding for children from disadvantaged families
- making childcare free for the lower paid
- raising benefits for the young who live independently
- helping the young find jobs to match their skills
3. Tackle working age poverty by
- developing strategies to increase productivity
- making public sector employers pay the Voluntary Living Wage
- encourage better part-time jobs
- reducing labour market exploitation
Three themes are evident: reducing the cost of living, increasing expenditure on some benefits and improving the labour market.
The report proposes economic growth and higher productivity as the main solution to poverty. It seems to reject more taxes on the affluent to support the poor: The forward says that arguments to fundamentally redesign the system of tax and benefits ‘have run their course’. [Note 1]
However, Part 1 clearly showed that continued economic growth was incompatible with saving the climate and consumption by the rich and affluent must fall substantially. This means a fundamental redesign of tax and benefits – and much more.
The JRF and climate change
The JRF vision is for workers with more skills, greater productivity and better wages. They have a share of the rewards of economic growth. This is the ‘inclusive growth’ promoted by the Organisation of Economic Cooperation and Development (OECD):
Inclusive growth is economic growth that is distributed fairly across society and creates opportunities for all.
The message is: If more is produced, everybody can benefit. Rich and poor alike.
Part 1 showed growth – even ‘inclusive growth’ – causes an increase in greenhouse gas emissions, making climate change worse. The JRF policy of inclusive growth is in conflict with combating climate change.
I suggest here that the JRF has resolved this conflict by abandoning climate change.
Has the JRF has abandoned climate change?
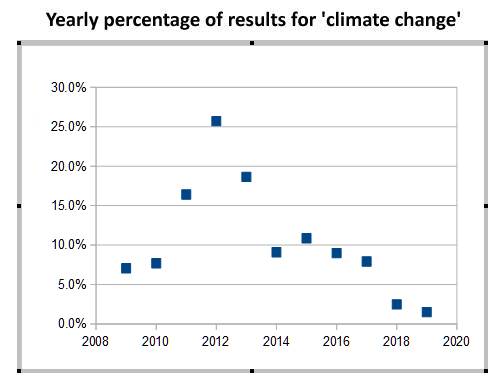
For a few years, the JRF had an interest in climate change but it has waned as the following graph shows.
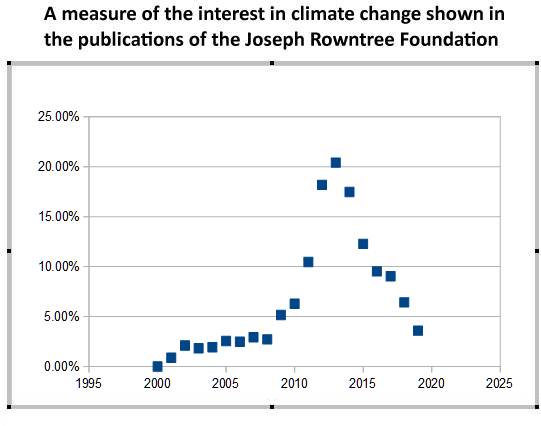
The graph is based on Google searches of the JRF website for the terms ‘climate change’ and ‘inclusive growth’. It shows an increasing interest in climate change building up to a peak in 2012 and then falling rapidly. More explanation is given in the Appendix: A test for JRF interest in climate change.
But JRF did commission interesting work
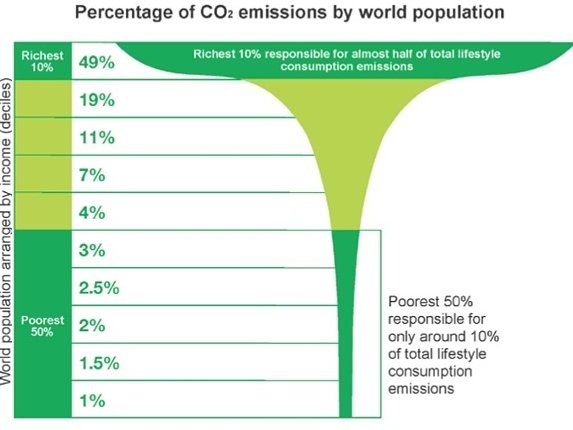
The JRF have publications on their website that indicate which groups should be cutting consumption. One, in 2013 showed it is the wealthiest that cause most greenhouse gas emissions. This confirms the infographic from Oxfam showing the wealthiest produce much more carbon emissions
The following table is made up from data in the report the JRF commissioned, Distribution of carbon emissions in the UK: Implications for domestic energy policy: It shows the most affluent 20% of the UK have carbon emissions several times that of the poorest 20%.
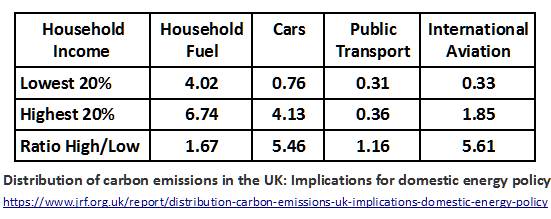
Data from Figure 10: Distribution of Carbon Emissions in the Uk: Implications for Domestic Energy Policy
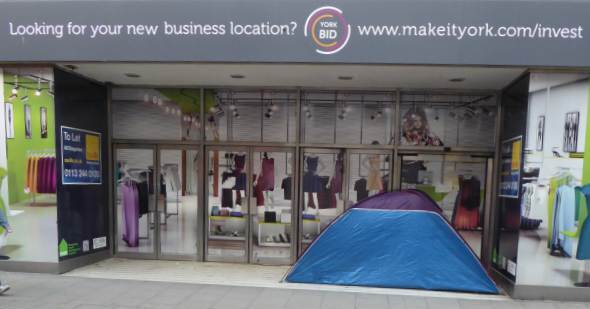
We have a climate crisis cause by the consumption of the wealth and affluent. The affluent must cut their high carbon consumption. They must quickly find better, less polluting ways of living. My suggestions, less flying, fewer cars, less meat and don’t build with bricks and steel. And give some money to the person in that tent in Coney Street: You are polluting the world and should be paying to those that don’t. Perhaps even join the Pollution Tax Association.
It is clear that ‘inclusive growth’ is a route to climate destruction.
The Joseph Rowntree Trust must rethink.
Note 1
It is easy to be blinded by simplistic and superficial responses. You can blame individuals for the bad decisions they make, and fool yourself into believing it could never happen to you. Or you can blame national structures – if only the system of tax and benefits could be fundamentally redesigned, and structural inequality abolished, then poverty could be ended.
These two arguments have run their course. Neither argument is an accurate explanation of poverty in the UK, and neither offers a workable solution on its own.
From the Preview of the JRF report, UK poverty: Causes, costs and solutions
Appendix: A test for JRF interest in climate change
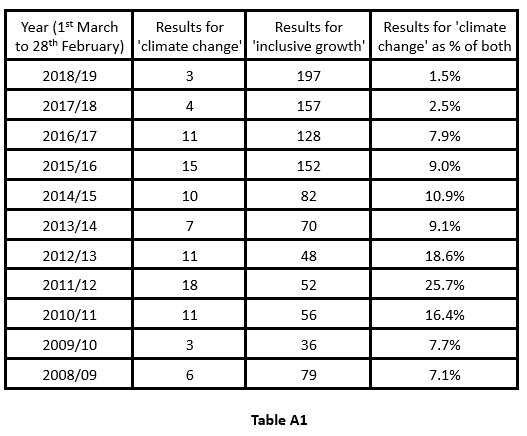
I used Google searches to construct this test: I searched for the term ‘climate change’ on the JRF website for the past 30 years and counted the results. To avoid any tendency for changes in the frequency of web publishing over the years, I also used the search term ‘inclusive growth. Counts for the past eleven years are in Table A1. The years are taken from 1st March one year to the 1st March the next. The fourth column is the percentage of results for ‘climate change’ compared to the results for both searches.
The resulting graph was:
The peak is in 2012. To smooth the year to year results, I combined the yearly results in groups of three years so, for example the figure for the year ending 1st March 2009 is the average of the years ending 1007, 2008, 2009. This is the smoother graph:
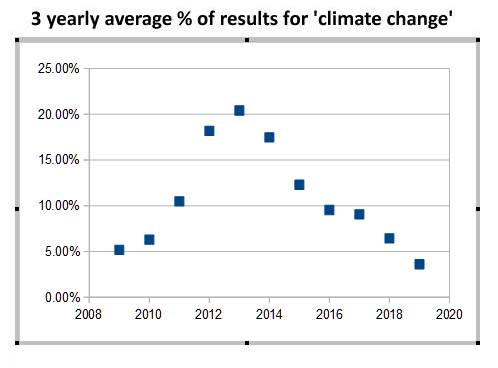
The peak is for years 2011-2013, centred on 2012. A fuller graphh is in the main text
TrackBack URL :