
Topics for enhanced town planning: #1 to #5
We must find new ways of living: New pleasant ways of living that do not destroy Planet A.
This requires a new form of town planning. Today’s town planning may be a starting point but a new, wider discipline is needed to make radical changes to the way we live. The idea was outlined in an earlier post, Enhanced Town Planning.
Here are the first five topics for the new discipline. More topics: Topics for enhanced town planning: #6 to #10
#1 A reference target for personal remaining carbon budget: 64 tonnes CO2e
A remaining carbon budget is the quantity of greenhouse gases that can be emitted before a global climate disaster occurs. This note estimates a reference budget: a quantity of emissions to be used as an indicator of the success or failure of the global climate policies.
If we keep within this budget, we are doing well: Exceed it and we are doing badly.
A common interpretation of ‘climate disaster’ is reaching a 1.5°C rise in the global average temperature since pre-industrial times. However, there are different ways of calculating the global average temperature. There are also different interpretations of ‘pre-industrial’. Other problems with this approach were discussed in Cheating with temperature:
One of these problems is [global average temperature] must be related to real effects that matter: sea-level rise, droughts, floods, storms, crop failures, heat deaths, species extinctions & etc. No one seems sure of the relationship between global temperature and these disasters.
However, it is common to use global average temperature as the measure. Currently the 1.5°C rise is the measure for ‘climate disaster’ so it will be used in these notes.
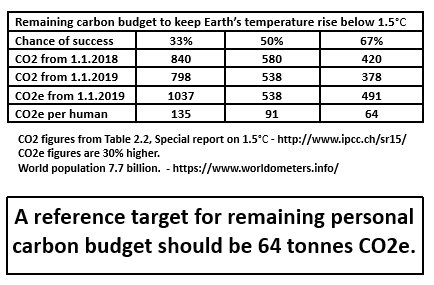
The remaining carbon budget to keep the Earth’s rise in temperature below 1.5°C with a 67% probability, has been estimated as 446 billion tonnes of CO2-equivalent (Gt CO2e) . [Note 1/1] That’s 64 tonnes CO2e for each of the 7.64 billion humans on Earth today.
The latest figures available for the UK’s carbon emissions were 11.94 tonnes CO2e per UK citizen per year. [Note 1/2] If these were steadily cut to zero in 12 years, the emissions would average 72 tonnes per person.
Even with this extreme 12-year reduction of UK emissions to ’net zero’, the UK would exceed the reference budget of 64 tonnes CO2e.
#2 New towns and villages
In the last century, new towns and villages were built to create better ways of living – fresh starts to avoid the mistakes of the past. There were the garden cities of Ebenezer Howard, planned to be big enough to have a city’s qualities but small enough to have nearby countryside and, on a smaller scale, villages built by successful industrialists to provide high quality housing for their workers.
These developments were separate from existing towns. They decanted population from the towns but did little to change the towns themselves. It was ‘the old has failed, let’s start anew’.
The climate crisis demands something different. The creation of new settlements must contribute to changing the lives of the residents in existing villages, towns and cities. New settlements should be add-ons to existing settlements helping to change the existing into pleasant, environmentally sound places to live.
See Garden Cities and Green Evolutionary Settlements.
#3 Embodied emissions and national accounts
The greenhouse gas emissions emitted in creating products are called embodied emissions. They can be large: A new car can have caused tens of tonnes of emissions in its manufacture. Building a new conventional house can cause the best part of 100 tonnes CO2e to be emitted.
Embodied emissions are important because they happen before products are used. Advances in technology which might reduce these emissions in future cannot be applied to manufacturing or building processes that has already happened.
Embodied emissions are important in the consideration of national accounting. The measure of greenhouse gas emissions favoured by the Department of Business, Energy and Informations Services (BEIS) includes only emissions that happen in the UK, called territorial emissions. This excludes the emissions from making the goods imported into the UK and also excludes emissions from air travel and shipping.
Fortunately, the Department of Environment of Environment, Food and Rural Affairs (DEFRA) publish estimates of UK carbon emissions calculated on a consumption basis. These do include the embodied emissions in UK imports as well as emissions caused by aviation and shipping. This measure will be used in these notes.
#4 New cars
Cars create large amounts of greenhouse gases in their manufacture – their embodied carbon. In How bad are bananas, Mike Berners-Lee gives these estimates:
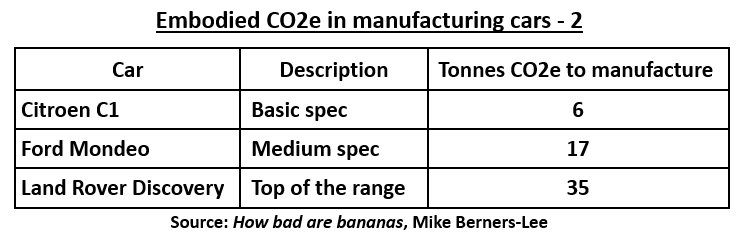
Tailpipe emissions for most cars are available. These should be up-rated to account for the production, transportation and refining of fuel. For a car in the UK, the average lifetime is 13.9 years and average distance traveled is 11,481 kms/yr. Embodied carbon added to emissions from a car for its lifetime gives:
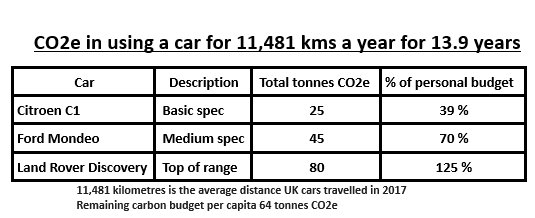
In Factcheck: How electric vehicles help to tackle climate change by Zeke Hausfather of Carbon Brief gives the emissions of a Tesla Model 3 as 45 gm CO2e/km. That’s 7.0 tonnes CO2e over an average UK car’s 13.9 year lifetime traveling 11,141 kms/year. To that add between 12 and 19 tones of CO2e for manufacture. This gives a figure in the region of 20 tonnes CO2e – or about a third of a reference remaining carbon budget.
In the next few decades emissions from the cars on today’s market cause unacceptable levels of greenhouse gas emissions – compared to the reference remaining carbon budget. Mass car ownership must be designed out of our lives.
Most modern cars weigh rather more than 1 tonne and have top speeds well over 70mph: e.g. A Ford Mondeo weighs over 1.7 tonnes an has a top speed of 116 mph upwards.
These cars carry people who, on average, weigh 5% of the car’s weight and in neighbourhoods, villages, towns and cities “twenty’s plenty”. Let’s replace the car monsters with new vehicles, weighing less than 150 kgs designed for speeds less than 20 mph.
See also:
- A numerical assessment – Cars to drive or a planet to live in?
- Carbon emissions in the lifetimes of cars.
- Car-free living and happy degrowth.
#5 Growth, wages and poverty
Increase the productivity of workers and they produce more. As workers produce more their wages increase. Some claim this is the way to end poverty, through inclusive growth – an increase in economic output shared by everyone. The problem is current economic output causes greenhouse gas emissions. More output causes more emissions.
Mike Berners-Lee has estimated that for every £1000 you spend on a new car, its production has caused the emission of 636 kgs of CO2 – plus some other greenhouse gases.
More generally, The Global Carbon Project has estimated that, in 2017, for every £1000 spent in the world on goods, an average of 422 kgs of CO2 were emitted. This number is the emissions intensity of production. Global greenhouse gas emissions are determined by this factor and the total amount of production, described by the relationship:
Global emissions = global GDP * Intensity_of_Production
It is theoretically possible for economic output to increase and greenhouse gas emission to fall – if the same amount of goods can be created with fewer emissions: A simple example would be a switch from plastic clothes pegs to wooden ones when the same value of pegs were produced. However, the history of the past few decades is that the global emissions are not falling.
In order to keep within remaining carbon budgets, global emissions must fall by 4% a year or more. In order to achieve this without reducing global production (global GDP), the intensity of production must also fall at 4% a year or more.
However, over the past three decades, the global intensity of production has only been falling by about 2%. Unless this can be made to fall much faster, a fall in global GDP over 2% or more a year is necessary. That’s global degrowth.
Degrowth means less is produced so the average worker must produce less. This means the worker is less productive and so have lower wages. As growth is not possible any growth, even ‘inclusive growth’, cannot be a means to increase workers’ incomes and ‘solve poverty’.
A policy of inclusive growth not only ignores climate change but it also diverts attention from the source of most of the greenhouse gas emissions. This is the consumption by the rich and affluent.
This points to one solution to poverty: Tax the polluting rich and pay the poor, who pollute much less. This could also generate jobs that are less productive but more pleasant. More pleasant because financial incentives to work would be less so workers would be more able to chose to do what they liked.
See: Climate destruction 1: Economic Growth
And: Climate destruction 2: Rowntree policy
[Note 1/1] A reference carbon budget
There have been various papers estimating remaining carbon budgets. Last year, Carbon Brief published several for keeping the Earth’s average temperature below a 1.5°C rise since pre-industrial times. The estimates ranged from a negative budget, requiring 192 Gt CO2 to be extracted to a positive remaining budget of 779 Gt CO2. These budgets were estimated to give a 67% chance of keeping within the 1.5°C limit.
Previous posts here have used a mid-range estimate from these of 395 Gt of CO2, from a paper by Tokarska & Gillet. This paper estimated that from the end of 2017, another 395 Gt of CO2 would raise the Earth’s average temperature to the 1.5°C limit.
Last October the authoritative IPCC published a special report (SR15) on keeping within the 1.5°C limit. It gave estimates of remaining carbon budgets based on probabilities of succeeding of 33%, 50% and 67%. Using estimates in Table 2.2 of the report, the table below has been calculated.

This involved updating the budgets, converting them to Carbon Dioxide Equivalent (CO2e) to take account of other greenhouse gases and dividing them by the number of humans on Earth. This gave an estimate for the reference carbon budget of 64 tonnes CO2e for each person on Earth.
[Note 1/2] Current emissions
Due to a lag in collecting and analysing data the latest year for which figures are available is 2016. Then the greenhouse gas emissions for the UK were 11.94 tonnes CO2e per capita. See The UK will be over 4 times over budget
TrackBack URL :