
The UK will be over 4 times over budget
Sending manufacturing overseas lowers our production based emission but then we import the goods increasing our consumption emissions.
Good progress? UK’s CO2 emissions keep falling
Carbon Brief has shown UK’s CO2 emissions fell for record sixth consecutive year:
The UK’s CO2 emissions have now been falling for six consecutive years, the longest run of reductions in records going back to 1850 (the blue area in the chart, below).
There were particularly large falls in 2014 (8.7%) and 2016 (5.9%), with 2018 seeing a more modest 1.5% reduction, according to Carbon Brief’s analysis. This means the UK’s CO2 emissions stood 39% below 1990 levels at an estimated 361MtCO2 in 2018.
This article measured the CO2 emissions from energy use in the UK. Emissions from making imported goods are not counted so when the UK manufacturing shuts down and its goods are replaced by imports, these measures fall.
This good progress will be hard to follow
On the BBC News Channel, Dr Simon Evans of Climate Brief did point out that “something like 97% of the reduction was down to using less coal to generate electricity so other parts of the economy aren’t doing so well”.
Our policy editor @DrSimEvans spoke to @BBCNews this morning about our new analysis which shows UK’s CO2 emissions fell for record sixth consecutive year in 2018 . Read more: https://t.co/f3xg6YJzVf pic.twitter.com/wLsZEqQvt4
— Carbon Brief (@CarbonBrief) March 4, 2019
Now there is a much less coal fired electricity generation this good progress will be harder too follow.
More good progress?
Another ‘good progress’ story is in a letter to Nature, Drivers of declining CO2 emissions in 18 developed economies, by Le Quéré et al. It shows that countries with the correct policies can lead to a reduction in CO2 emissions:
Here we analyse the drivers of decreasing CO2 emissions in a group of 18 developed economies that have decarbonized over the period 2005–2015. We show that within this group, the displacement of fossil fuels by renewable energy and decreases in energy use explain decreasing CO2 emissions. However, the decrease in energy use can be explained at least in part by a lower growth in gross domestic product.
Here is a hopeful looking graph from the paper:
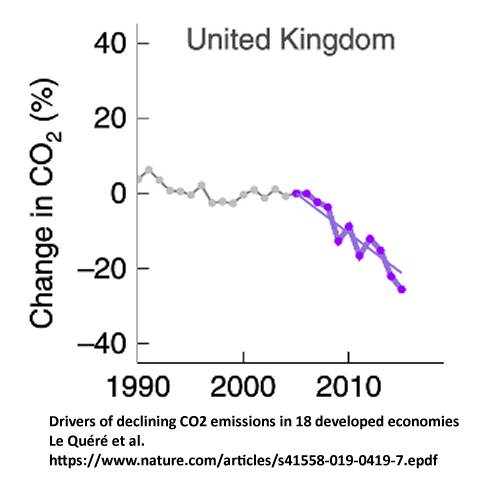
In years 2005-1015 UK CO2 emissions fell by over 20%
This graph misled me at first. The trend line seems to cross the x-axis in roughly 2022. It looks a very steep decline of 20% in a decade – very good progress. But the x-axis is positioned at roughly a reduction -44% but to reach zero emissions (-100%) at this rate takes 50 years from 2005. That’s in 2055.
The letter notes that the effects of outsourcing are small:
Outsourcing of emissions through trade was small … and does not account for [a] substantial contribution to CO2 reductions.
This means that, in any given year, if no further manufacturing has been shipped overseas, outsourcing does not cause a further fall in emissions – but, of course, the results of past outsourcing will mean manufactured goods are being imported having created emissions overseas.
The letter does consider consumption emissions in identifying the countries with good records of cutting emissions:
We isolate a ‘peak-and-decline’ group of 18 countries where emissions have significantly decreased over the 2005–2015 period, considering both territorial and consumption emissions
In supplementary table S2, consumption emissions for the UK (1005-2015) are given as falling at 2.1% a year. Just suppose that trend continued then zero consumption emissions would occur around 2060. UK consumption emissions until then would have made a large inequitable contribution to global warming.
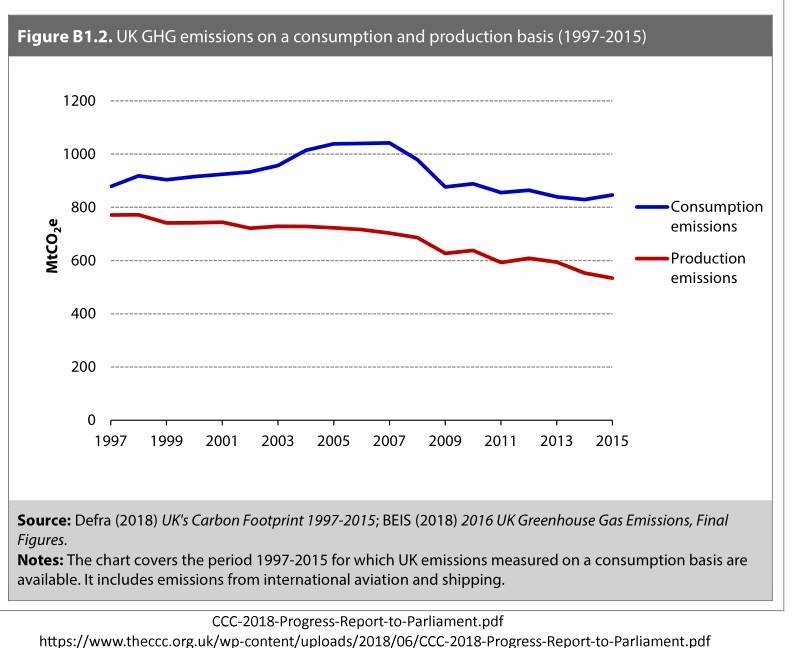
For the UK, the estimates of emissions from the Department of Environment Food and Rural Affairs, present a clearer picture.
Emissions based on UK consumption.
Note:
- In 2015, UK consumption emissions were 847 MtCO2e for a population of 65.1 million, averaging 13.0 tonnes CO2e per capita per year.
- In the period 2005-2015 the fall in emissions based on UK consumption was 2.27% a year.
- In the period 2009-2015 the fall in emissions based on UK consumption was only 0.57% a year.
Perhaps 2016 consumption emissions, which are published soon, will show a better trend. In the mean time…
Some crude but simple maths shows the bad news:
Emissions excluding imports & etc. are clearly nonsense. Shut UK’s manufacturing and import the goods and carbon emissions due to production go down. This ignores the emissions caused by making the imports.
The following numbers from Defra’s UK’s Carbon Footprint 1997 – 2015 :
Consumption emissions over the decade 2005-2015 (latest figures available) fell from 1039 Mt CO2e to 847 Mt CO2e an average drop of 19.2 Mt a year. At that rate emissions should reach zero by 2059.
Assuming a continued rate of fall of 19.2 Mt/year, The UK carbon emissions from end 2018 would be 16,257 Mt CO2e. That’s 246 tonnes for each of UK’s 66 million humans.
A mid-range figure published by Carbon Brief for the remaining carbon budget for 1.5°C is Tokarska & Gillet’s 395 Gt CO2 from the end of 2017(. That’s 354 Gt CO2e by the end of 2018. Converting to a basket of greenhouse gasses by adding 18% gives emissions of 418 Gt CO2equivalent. That’s a remaining greenhouse gas budget for 1.5°C of 55 tonnes CO2e for each of Earth’s 7.6 billion humans from the end of 2018.
So on these estimates we have:
UK humans will emit 246 tonnes CO2e each
against a world budget of 55 tonnes per human.
Note: This was originally titled “The UK will be over 5 times over budget”. I must be more careful with my spreadsheets.
Postscript 3rd May 2019 : Remaining carbon budgets.
In a later post Climate destruction 1: Economic Growth, a different source for remaining carbon budgets has been used. This doesn’t make substantial difference to the argument. It emphasises the conflict between controlling emissions and economic growth.
comment
TrackBack URL :
Also worth noting that none of these figure include our share of international aviation or shipping, which is non-trivial (and rising).
Unfortunately these ‘complete emissions’ numbers are harder to come by, but we really should encourage quoting of full-picture numbers, otherwise we are just deceiving ourselves with over-optimistic graphs.
The combination of international transport and consumption numbers puts the UK average closer to 10 tonnes per capita per annum, than the 5-6 tonnes you get from production emissions alone, and not falling very fast either.