
Robot revolution, growth, and global warming
This is a minor rewording of a submission to Tom Watson’s Commission on the future of work. It introduces an extra element to discussions about the robot revolution: Climate change.
The original can be down loaded as a PDF here.
Robot revolution, growth, and global warming
Note for the Commission on the Future of Work
A robot revolution?

In Robot wars – Automation and the Labour Market, Adam Corlett asks, ‘Should we be concerned that robots will ‘take all the jobs’?’ He contrdicts Frey and Osborne who, in The Future of Employment, claim that, ‘as many as 47 per cent of jobs in the US are susceptible to automation over the next two decades’. Corlett points to OECD research, which suggests, ‘in the US only 9 per cent of jobs are threatened over the next 20 years’.
Corlett reports, ‘while the idea that machines will displace workers has a venerable tradition, history has so far not borne the prognostics out’. He says ‘automation has in the round led to the creation of new jobs and improved living standards’, pointing out that as many new jobs are being created as old ones are being lost. The current robotisation is not much different from previous rounds of automation. The UK needs more robots to boost labour productivity to allow high wages.
The paper’s conclusion says:
… the experience of the past 20 years (if not the past 250 years) provides some reassurance that the overall negative consequences of automation are easy to overstate. Part of the logical policy response would be encouraging more investment, research, education and responsive regulation; while continuing to pursue goals of high pay and full employment
‘Negative consequences of automation’ probably include temporary mass unemployment, which is later overcome by economic growth, because increased consumption and production (Note 1) create demand for labour. This pushes up wages and employment. What Corlett doesn’t mention is that the growth in consumption has been accompanied by an increase in greenhouse gasses, the main cause of climate change.
Below I argue that, to avoid dangerous climate change, global production and consumption cannot be increased in the next few decades. Therefore, whilst automation is not new, we must approach this latest technological revolution in a new way. This time it is different.
Below I consider 3 categories of economic growth:
- Green growth: More consumption without ruining the climate.
- Inclusive growth: Growth where everyone consumes more.
- Degrowth: Total consumption falls but everyone is happier.
Green growth, inclusive growth and degrowth
The OECD say green growth is
… economic growth and development while ensuring that natural assets continue to provide the resources and environmental services on which our well-being relies.
The implied claim is that world economic activity can increase but the resulting greenhouse gas emissions do not cause dangerous climate change. However, for growth to be green and not trash our climate, GHG emissions must remain within defined limits. (That is until greenhouse gasses can be extracted from the atmosphere. Extraction is mooted to become possible in the second half of this century.) Rough calculations are presented below to explore the idea of ‘green growth’.
The OECD say inclusive growth is
… economic growth that creates opportunity for all segments of the population and distributes the dividends of increased prosperity, both in monetary and non-monetary terms, fairly across society.
This means that no section of society is worse off. The increased production from growth allows both rich and poor to consume more: Everyone gains.
In What is Degrowth?, Demaria et al. say
Degrowth was launched in the beginning of the 21st century as a project of voluntary societal shrinking of production and consumption aimed at social and ecological sustainability.
The ‘meaning of life’ source of degrowth also draws on findings in the literature on the economics of happiness.
This paper attributes the meaning of ‘degrowth’ to a movement wanting to persuade societies to voluntarily shrink production and consumption – and become happier.
- Green growth: More consumption without ruining the climate.
- Inclusive growth: Growth where everyone consumes more.
- Degrowth: Total consumption falls but everyone is happier.
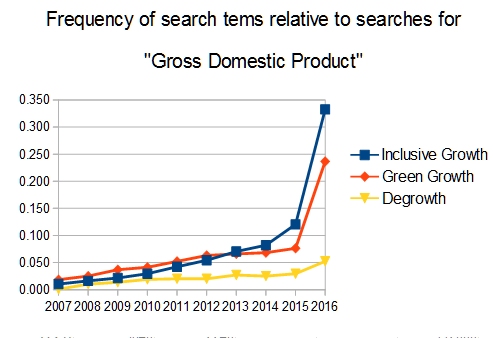
Internet searches on growth ideas
To find an overall impression of how interest in these ideas of growth has changed recently, I used the Bing search engine to look for the number of results for the phrases, ‘Green growth’, ‘Inclusive growth’ and ‘Degrowth’ for each year in the past decade. To give a baseline related to economics, I did the same for the search term ‘Gross Domestic Product’.
The graph below shows the number of results giving the frequency of results by year of publication divided by the number of results for ‘Gross Domestic Product’.
(e.g. for the year 2012 there were 6209 results for the search term ‘green growth’ and 116,000 results for the search term ‘gross domestic product’. This gives a ratio of 0.054 as shown on the graph for the year 2012.)
These numbers fit the overall impression that interest in ‘green growth’ is increasing but not as fast as ‘inclusive growth’. Unsurprisingly, ‘Degrowth’ is increasing but at a lower level.
The remaining carbon budget
The most important cause of global warming is the greenhouse gas, carbon dioxide (CO2). To be classed as green, economic growth must avoid the emission of CO2 at levels leading to dangerous climate change.
Bodies like the Intergovernmental Panel on Climate Change (IPCC) and the Global Carbon Project (CGP) make estimates of how much more CO2 can be emitted before we reach certain markers for climate change. In Only five years left before 1.5C carbon budget is blown, Carbon Brief wrote
In its most recent synthesis report, published in early 2014, the Intergovernmental Panel on Climate Change (IPCC) laid out estimates of how much CO2 we can emit and still keep global average temperature rise to no more than 1.5°C, 2°C or 3°C above pre-industrial levels.
The 2°C rise has been set in various international agreements as the threshold of dangerous climate change. Last year’s Paris Agreement concluded:
Holding the increase in the global average temperature to well below 2 °C above pre-industrial levels and to pursue efforts to limit the temperature increase to 1.5 °C above pre-industrial levels, recognizing that this would significantly reduce the risks and impacts of climate change;
To keep within a 2°C rise in global temperature the Global Carbon Budget 2016 calculates that a further 800 gigatonnes of CO2 can be emitted into the atmosphere. (800 gigatonnes is 800 billion tonnes of CO2 – a bit more than 100 tonnes of CO2 for every person on Earth.) This demonstrates that to keep within the threshold of 2°C we have a ‘remaining carbon budget’ of 800 gigatonnes of CO2.
Making the remaining carbon budget last
The IPCC and others now assume that in the second half of this century, it will be possible to extract large amounts of CO2 from the atmosphere. (This is referred to as negative carbon emissions.) The 800 gigatonne budget must last until large scale extraction becomes possible, if global temperatures are to remain within the 2°C limit.
GCP reports that global emissions of CO2 in 2016 were 36.4 gigatonnes. To enable the budget of 800 gigatonnes to last until, say, 2060 we must have an exponential reduction in CO2 emissions of 3.7% a year.
Staying within the remaining carbon budget must be part of the OECD’s meaning of green growth (see above), which demands that ‘natural assets continue to provide the resources and environmental services on which our well-being relies‘.
World GDP and the carbon intensity of production
Emissions of CO2 can be analysed as two factors: the amount of production (e.g. world GDP in dollars) and the carbon intensity of production, the average amount of CO2 emitted for each unit of production (e.g. kilograms of CO2 emitted per $ of production). We can say
global CO2 emissions = world GDP ($) * average carbon intensity of production (kgCO2/$)
In this analysis, there are two ways in which reductions in carbon emissions can be achieved.
1. Production can fall or
2. The intensity of production can fall.
Reducing production by 3.7% to meet the required reduction of carbon emissions would impoverish the world. However, is it possible to stay within this limit -without reducing world GDP – by a reduction in carbon intensity of 3.7%?
To prevent the level of consumption per person from falling, the rate of decarbonisation must be even larger because the world’s population is increasing. The 2015 Revision of World Population Prospects suggests a global population increase from 7.3 billion to 9.7 billion by 2050 – a growth rate of about 0.6%. This means that the carbon intensity of production must fall at a rate of 4.3% (3.7%+0.6%) to maintain current world average levels of consumption.
If decarbonisation of production can’t fall fast enough (i.e. 4.3% per year), then levels of production must fall to keep within the remaining carbon budget (The budget to keep within a 2°C rise in global temperature). This means falling consumption and serious consequences for the future of jobs.
Recent experience
A figure in the Global Carbon Budget 2016 demonstrates changes in carbon intensity of emissions.
Emissions per unit economic output (emissions intensities) generally decline over time
China’s intensity is declining rapidly, but is still much higher than the world average.
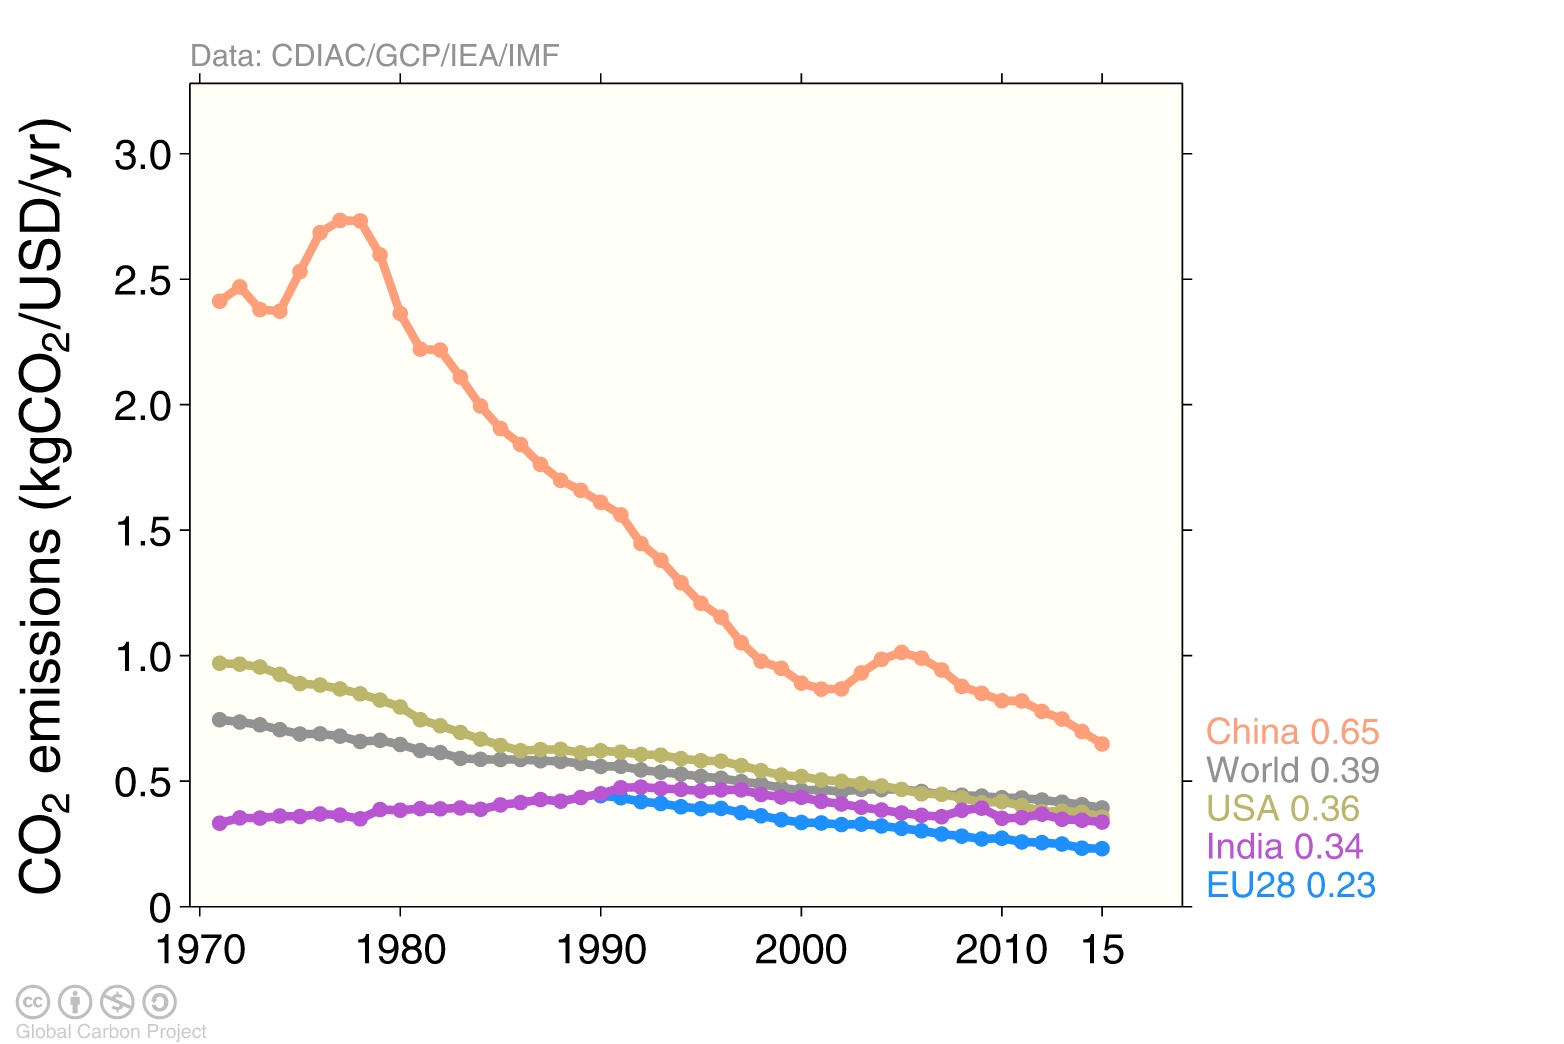
Source: CDIAC; IEA 2015 GDP to 2013, IMF 2016 growth rates to 2015;
Le Quéré et al 2016; Global Carbon Budget 2016
Inspection of this graph indicates that over the decade to 2015 emission intensity for the world has decreased by about 1.9% per year (and decreases by each region are roughly: China 3.5%, Europe 3%, USA 2.5%, India 1% ).
In Projections and uncertainties about climate change in an era of minimal climate policies, William Nordhaus plots the carbon intensity of production over the period 1960 to 2015. He finds the rate of decarbonisation over this period to average 1.4% per year but he does note ‘the increase in the rate of decarbonization in the last few years’.
The estimates for the rates of decarbonisation of production over recent decades from GCP and Noordhaus are only a fraction of what is needed to avoid dangerous climate change. We need much higher rates of decarbonisation to make any growth ‘green growth’.
The difficulty in achieving green growth has a corollary for ‘inclusive growth’ in which every group consumes more. No ‘green growth’ means no ‘inclusive growth’ unless we are willing to accept the consequences of dangerous climate change. What remains, ‘however implausible’ is some form of de-growth.
Robots, high pay and full employment
In his paper, Corlett concludes we should continue to ‘pursue goals of high pay and full employment’. However, high pay demands requires high productivity and high productivity with full employment means more production – and so more consumption. To achieve more production, stay within the remaining carbon budget and allow for population increase, the rate of decline of carbon intensity must exceed 4.3%. Probably impossible.
If the required rate of decline is impossible and the working population does not fall, then each worker must produce less. This can happen by workers working shorter hours or being less productive – or both. This will cause take home pay to fall – and this effect will increase as robots replace workers – as the owners of robots and associated intellectual property collect an increased share of the proceeds of production.
If something we call ‘full employment’ is an aim and we want to avoid dangerous climate change, workers will need to work fewer hours or to be less productive – or both.
Policymakers and the media see creating jobs as a priority. This is apparent from results from the the Bing search engine. It gives 14 times more results for ‘new jobs’, than for ‘Gross Domestic Product’.
But ‘productive work’ and measured by its economic output may not give society the expected rewards. The Guardian’s article Cleaners worth more to society than bankers reports a study by the New Economics Foundation:
Elite City bankers (earning £1m plus bonuses) destroy £7 of value for every £1 they create and advertising executives wreck £11 of value for every £1 they are paid.
Childcare workers create between £7 and £9.50 of value for every £1 of pay and hospital cleaners create more than £10 in value for every £1 they receive in pay.
In addition, there is the value of work to the worker other than wages. The report, Is work good for your health and well-being? was commissioned in 2006 by the Department of Work and Pensions. The authors, Gordon Waddell and A Kim Burton, concluded
There is a strong evidence base showing that work is generally good for physical and mental health and well-being. Worklessness is associated with poorer physical and mental health and well-being.
The value Elite City Bankers to society and the health benefits of work are valid and important topics for discussion but for this note I am setting these considerations to one side concentrating on the more quantifiable items in economics and climate science. (See APPENDIX 2, Prototype settlements, Timothy Worstall and the New Economics Foundation.)
Is climate change worse than we think?
Climate change may be worse than the Global Carbon Project suggests. The climate models that underlie their figures (the CMIP5 models) had missing feedbacks, which mean they underestimate the pace of climate change. Just before the Department of Energy and Climate Change (DECC) was dissolved, DECC’s scientists confirmed this
DECC (as for the IPCC) has not made any direct estimate of [missing feedbacks]. Understanding of the feedbacks currently excluded from climate models is constantly evolving, though the majority of these feedbacks, if included, would likely further reduce the available global carbon budget.
In addition, there is uncertainty about the feasibility of technologies that will (or might) extract carbon from the atmosphere. In Responses to: The Trouble with Negative Emissions, (Geoengineering Monitor, November 2016), the authors Kevin Anderson and Glen Peters say
We support research on the technical, environmental, social, and economic viability of negative-emissions technologies. However, we stand by our conclusion that given the breadth and depth of fundamental uncertainties associated with negative-emissions technologies (1–6), a program of timely and deep mitigation in line with 2°C budgets should assume that they will not be deployed at a large scale.
In short, we cannot assume that extracting carbon from the atmosphere will save us from climate change in this century.
The Global Carbon Project report that for the past few years greenhouse gas emissions have been more-or-less constant but this has yet to show in the record of CO2 concentrations in the atmosphere. This shows that concentrations are increasing – even slightly accelerating.

Summary:
Question: Is green growth possible?
Answer: Not anytime soon.
Question: What does inclusive growth do, ‘where everyone consumes more’ ?
Answer: In the medium term, it will destroy the climate.
Of the three growth concepts, some form of degrowth is the ‘however implausible’ survivor – but perhaps not quite the same flavour as in its ‘everyone is happier’ version.
A prerequisite to investigating degrowth is to find out who generates greenhouse gas emissions.
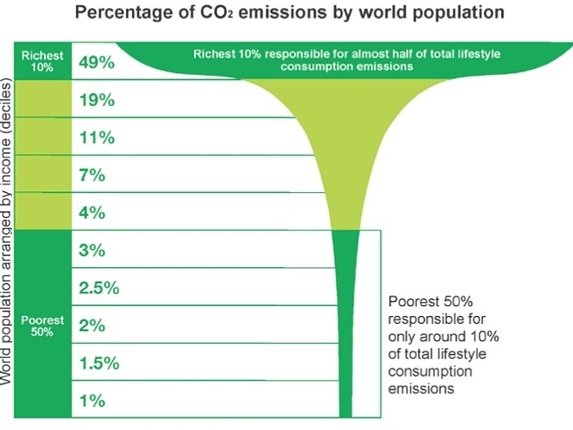
Who is most responsible for greenhouse gas emissions?
An infographic in Extreme carbon inequality by Oxfam shows the poorest half of the world’s population cause about 10% of global CO2 emissions and the wealthiest 10% cause about half of the emissions.
Data from the World Bank show that in 2015, GDP for the whole world was $15,673 per capita (current international $). In the UK, GDP per capita was $41,756, 2.7 times the world average.
In UK’s Carbon Footprint 1997 – 2013, the UK Department of Environment and Rural Affairs (DEFRA) gives the carbon emissions for the UK as 745 million tonnes of CO2 (1050 tonnes of CO2 equivalent when other greenhouse gasses are included). Since the UK population in 2013 was 64.1 million, the average emissions per capita was 11.6 tonnes CO2. The Global Carbon Project gives CO2 emissions per person in the world for 2013 as 4.9 tonnes CO2. This makes emissions of CO2 per capita in the UK 2.4 times the world average.
The UK is not the wealthiest country in the world but it is near the top of the league and is part of the wealthy ‘developed’ world. It also has much greater than average carbon emissions – fitting in with with Oxfam’s infographic showing the rich pollute more than the poor.
However, within each country the distribution of income is unequal and we can expect any country’s rich to generate greater carbon emissions than their poor. In 2008, I did a calculation using the P2 People and Places geodemographic system to test this for the UK. (See Geodemographics of greenhouse gas emissions in Questions for Lord Turner of the Climate Change Committee). I wrote
Affluent lifestyles have greater impacts on the climate than less affluent lifestyles. I have performed some estimates of carbon footprints ( as CO2 equivalent per year) using the P2 People and Places geodemographic classification from Beacon Dodsworth. In conjunction with the results of the Target Group Index from the British Market Research Bureau, I used selected P2 branches (from the wealthiest to the poorest) to get the following
|
P2 branch |
Private transport CO2e per year |
Air travel CO2e per year |
|
A1 – Worldly Horizons |
4.0 tonnes CO2e per year |
0.78 tonnes CO2e per year |
|
A5 – Established Prosperity |
3.5 tonnes CO2e per year |
0.76 tonnes CO2e per year |
|
D11 – Matrimonial Homes |
3.4 tonnes CO2e per year |
0.48 tonnes CO2e per year |
|
G17 – Aspiring Streets |
3.7 tonnes CO2e per year |
0.49 tonnes CO2e per year |
|
M35 – Impoverished Elders |
2.6 tonnes CO2e per year |
0.37 tonnes CO2e per year |
|
L37 – Deprived Youth |
1.8 tonnes CO2e per year |
0.21 tonnes CO2e per year |
These results confirm the expectation that people in the more affluent areas, have consumption patterns that produce significantly more CO2 emissions than people in poor areas.
Question: Who is most responsible for greenhouse gas emissions?
Answer: The affluent.
New lifestyles
We must examine consumption patterns and lifestyles – especially of the affluent. Affluent areas are where the most of the pollution is generated. Unfortunately many of the poor want to live like the affluent. We must design and engineer new lifestyles, which can evolve from our present societies, which have very low pollution levels but are attractive to rich and poor alike. It would be best if these are lifestyles that the affluent can be persuaded to adopt – and the poor can follow.
There may be many different low-pollution lifestyles, which can be designed, engineered or evolved from our present villages, neighbourhoods, suburbs, towns and cities. However, attempts to create ‘sustainable lifestyles’ have not yet been very successful, despite claims made for them. See for example my Three failed ecotowns, which has a description of one of these:
The “sustainable development”, Derwenthorpe in York has had the carbon footprints of the residents measured. Their average footprint is greater than the rest of York. The carbon emissions they save on the central biomass boiler they blow on increased travel. Embodied carbon was not measured.
The real shock is that the carbon footprint measured for Derwenthorpe was 14.52 tonnes per resident per year (using the REAP petite assessment method). That is over seven times more than the 2 tonne low-carbon limit suggested by the Green Ration Book.
The Green Ration Book estimates the carbon emissions from everyday activities. I started it in 2006 with support from UnLtd, the Millennium Charity and help from a group of friends. We convened a panel to judge the carbon footprints of consumption in everyday living. We used what available sources we could find – sources that were not always in agreement.
|
Item of consumption |
Carbon cost in |
Ration time |
|
Return car journey York to London |
128 kg |
85 days |
|
Using desktop computer for 8 hrs |
0.58 Kg |
10 hours |
|
A bunch of flowers from Holland |
36.00 kg |
24 days |
|
350gm of pork chops |
2.54 kg |
41 hours |
The Green Ration Book says:
The average UK citizen creates 11 tonnes of Carbon Dioxide equivalent (CO2e) a year. CO2e includes the effects of other greenhouse gasses as well as the main greenhouse gas, carbon dioxide.
New UK targets aim to cut this 11 tonnes by 80%.
Reducing these 11 tonnes by 80% gives a ration of 2.2 tonnes per year. This makes a daily ration 6kg CO2.
Dividing the ration equally between categories “consumables”, “building”, “transport” and “government”, allows 1.5kg per day per category.
The estimates below are for CO2e and amount of a 1.5kg daily ration. This is expressed as a time (e.g. a quarter of a daily ration would be given as 6 hours)
The “Ration time” column in the table above for the return car journey was 85 days. That is a single person return car journey from York to London accounts for 85 days of one person’s carbon ration for transport. Such numbers illustrate the difficulty of changing our everyday lives to keep within climate limits.
The Green Ration Book made judgements on carbon footprints on a consumption basis (i.e how much greenhouse gas was generated by our consumption.) On a similar basis, in UK’s Carbon Footprint 1997 – 2013, DEFRA gave the UK’s carbon emissions for 2013 as 1050 gigatonnes of CO2e. That’s about 16 tonnes CO2e for every person in the UK. (That is 11.6 tonnes counting CO2 alone.) There is a long way to go to get to 2 tonnes CO2e per person.
The design of new lifestyles, prototypes, which are truly sustainable must be a new field of interdisciplinary work. I favour starting at the scale of a large neighbourhoods. If they are too small, sustainable local services cannot be viable. Too large and the planning, building and evaluation become too great.
The range of possibilities is large but it is easy to identify aspects of affluent life that must change. There are things we just can’t do. We can’t travel as much (especially flying), build with bricks and steel or eat much beef. As noted above, employment must be less productive for the coming decades at least – but it might just be pleasanter.
If something we call ‘full employment’ is an aim and we want to avoid dangerous climate change, we may need less work and do less productive work.
Prototype settlements
As a beginning to the search for the design of ‘truly sustainable living’, I have written a few notes on prototype settlements that might help. In The Green Settlement Handbook I suggest some guidelines for one prototype of a settlement that might attempt at true sustainability without completely cutting itself off from the global economy
1. It will be managed by a social landlord or possibly a private landlord.
2. It will have legal covenants and financial incentives to encourage green behaviour.
3. It will attract residents who have:
1. a willingness to experiment
2. an environmental awareness
3. bikes and no cars
4. It will be built on a greenfield site with cycle routes to nearby urban centres
5. It will have food grown for local consumption
6. It will have public transport with good waiting areas
The success of such a settlement would be made easier by a Universal Basic Income (UBI) as it would enable less productive jobs that help the fight against climate change.
A Universal Basic Income eases the problems of lower production
A universal basic income is a form of social security in which all citizens or residents of a country regularly receive an unconditional sum of money, either from a government or some other public institution, in addition to any income received from elsewhere. See Wikipedia’s article for more details and lots of references.
One of the references is to a report by the Basic Income Grant Coalition which “implemented the world-wide first Basic Income Grant pilot project in Otjivero – Omitara, Namibi”. The report says
Since the introduction of the BIG, household poverty has dropped significantly. Using the food poverty line, 76% of residents fell below this line in November 2007. This was reduced to 37% within one year of the BIG. Amongst households that were not affected by in-migration, the rate dropped to 16%.
The introduction of the BIG has led to an increase in economic activity… The grant enabled recipients to increase their productive income earned, particularly through starting their own small business… This finding contradicts critics’ claims that the BIG would lead to laziness and dependency.
In an article in Forbes Magazine, An Unconditional Basic Income Is The Solution But The Important Word Here Is Basic, Timothy Worstall writes
a basic income is a very good idea indeed: the clincher for me is that it would eradicate those huge marginal tax rates that people at the bottom of the labour pile face… 100% tax rates really are a disincentive to work.
Timothy Worstall has also said elsewhere
I don’t consider myself right wing at all. I consider myself rather a lefty in fact. Assume, for a moment, that being a lefty means having the interests of the poor at heart. That we’d like the poor to get rich like we are.
The approaches of the BIG Coalition and Timothy Worstall are in some ways similar. They both have some interest in alleviating poverty and both want to encourage work so that more goods and services can be produced.
A telling comment by Worstall is “we’d like the poor to get rich like we are”. We might like that but, if the poor became “rich like we are” in the next few decades, we will easily run out of the remaining carbon budget and cause dangerous climate change.
If production is necessarily constrained to protect the climate, then working less could be a help in the aim for ‘full unemployment’. If production is constrained and employment levels do not fall, labour productivity must fall: The same number of workers with less production means lower productivity.
Lower productivity by itself means the poor, who depend mostly on wages, will become poorer. A compensating transfer, such as Universal Basic Income, can avoid this.
Robotisation deepens the problem because limiting output, when robots are displacing workers, cuts demand for labour and wages fall. Unsurprisingly, robotisation has been used as an argument for a Universal Basic Income. (e.g. Elon Musk says robots will push us to a universal basic income.)
Republicans for a Carbon Tax funding: A Universal Basic Income?
Recently the Climate Leadership Council has advocated a carbon dividends plan, which has four principles
1. A gradually increasing carbon tax
The first pillar of a carbon dividends plan is a gradually increasing tax on carbon dioxide emissions…
2. Carbon dividends for all Americans
All the proceeds from this carbon tax would be returned to the American people on an equal and quarterly basis …
3. Border carbon adjustments
Border adjustments for the carbon content of both imports and exports would protect American competitiveness
4. Significant regulatory rollback
The final pillar is the elimination of regulations that are no longer necessary upon the enactment of a rising carbon tax whose longevity is secured by the popularity of dividends.
This is exactly the Carbon Fee with Dividend, which has been advocated by the leading climate scientist, James Hansen for many years. The document is The conservative case for carbon dividends. Surprisingly (to me anyway) the majority of the authors are influential people in the Republican Party who have worked for past Republican Presidents.
Their plan can be viewed as a Universal Basic Income paid for by a carbon tax. It addresses the problems of climate change and that of supporting the bottom end of the labour market at a time when the productivity of labour must fall.
Reducing the cost of living for the poor
Another way of supporting the living standards of the poor, when the value of their labour is falling, is to reduce their cost of living. In A real agenda to reduce the cost of living, Ryan Bourne of the Institute of Economic Affairs, discusses “red herrings” which lead “politicians to advocate economically damaging interventions in product and labour markets”. He says
In my new paper, Low Pay and the Cost of Living: A Supply-Side Approach, I outline in detail the causes of high prices for housing, energy, childcare and food – and use the example of an imaginary illustrative family to outline how supply-side reform in these product markets and cuts to highly regressive sin taxes could reduce living costs for the household by up to £7,800 per year.
He says of housing costs
Academic analysis of the effects of planning policy suggests that planning constraints have increased prices by as much as 41 per cent. Moving to a sensible planning system could therefore reduce house prices and rents by the same margin over time, saving our family £3,120 per year.
My own research confirms this. In the UK, house price inflation has loaded enormous costs on the poor (and the young) and has been a bonanza for the affluent and the old. This realisation has had increasing coverage in the media. The coverage has greater emphasis on intergenerational effects rather than the effects on rich and poor. Perhaps because the affluent classes are worried about housing for their children. They don’t want their children to have to rely on their parents – too much.
In order to get some idea of the different effects of the housing market on the affluent and the poor, I downloaded house price data from the Land Registry for the years 2000 and 2010. I then looked at the changes in house prices for the most affluent areas compared to the least affluent areas. (I used the P2 People and Places Demographic Classification for this exercise.)
Adjusting for inflation between 2000 and 2010, I found that property of the most affluent areas increased by just over eight times the average income in 2010. Property prices in the least affluent areas rose by a factor of two. However, according to the 2011 census, only 20% of households in the least affluent areas own their homes. In the most affluent areas this rises to 90%.
House price inflation has given most households in the most affluent areas large increases in their wealth, at the same time most households in the least affluent areas will have paid increased rents.
Reversing this trend would help the poor have a better standard of living even as the value of their labour falls.
APPENDIX 1
An alternative to basic income: labour subsidies
Back in the 1970s, unemployment started to rise in the UK from the lower levels in the 1940s, 50s and 60s. I was also interested in a living a life which wasn’t dominated by the motor car. This was before any concern about climate change.
Non-economists, who hadn’t heard of the lump-of-labour fallacy would ask ‘What are you going to do with all the unemployed car workers?’. This prompted me to propose a economic mechanism to cure unemployment. This amounted labour subsidies for the low paid workers. I wrapped up these subsidies as a change to Value Added Tax. (See The employment effect of subsidies )
The scheme proposed an increase in the nominal rate of VAT that would be accompanied by a rebate for every worker employed. It was revenue neutral and because it reduced the benefit bill for unemployment, the total rebate was more than the revenue from the extra VAT collected. The result was to
Subsidise goods that use lots of labour, tax those that don’t.
Simple.
Incorporating labour subsidies as at a flat rate tax rebate per worker has its presentational advantages. As Professor Kim Swales said in our report to the European Commission:
If the labour subsidy could be incorporated as part of a tax scheme, in the form of tax rebates, the total tax take would actually fall.
And
[These proposals] do not rob the private sector of resources but reallocate resources within that sector. [They] generate an expansion, not contraction, of private sector economic activity.
One of the benefits of this scheme is that it can generate full employment even when GDP is falling as required by climate constraints. However, the current climate crisis requires a very high carbon price and support for a Universal Basic Income from high profile Republicans, may make a labour subsidy scheme a distraction. I include it here to show that maintaining full employment is possible in other ways.
The common feature here is that both schemes take from the rich to support the poor. In the case of a Carbon Tax funding a Universal Basic Income the justification is direct. The rich pollute the world much much more than the poor as the Oxfam Infographic above shows.
This is not just an issue for ‘The future of work’ it is one concerning future lifestyles and ‘The future of the planet’.
APPENDIX 2
Prototype settlements, Timothy Worstall and the New Economics Foundation
In Why nef stands for no economics foundation, Timothy Worstall scorns nef’s proposal for a 21 hour working week
… cutting production, incomes and possible consumption by a fairly hefty amount.
But it doesn’t stop there, oh no, there is more joy to come. In the comments up pops one of the neffers themselves to say:
A halving of hours means a halving of income: True, but then living costs would fall too, both direct (e.g. commuting, childcare) and indirect (e.g. food, as people would have more time to grow their own).
Err, what? We’re going to reduce the working week by increasing the amount of time that must be spent hacking away in fields? Blimey, that’s some very good indeed drugs they’ve got over there.
They also recommend that we do more of our own housework, make and mend more, darn socks and so on
Worstall concludes
nef are quite deliberately insisting that we turn our backs on [Adam Smith’s] division and specialisation of labour and go back to doing everything, ourselves, in our own households. This isn’t just perverse or stupid – it’s ignorant.
The proposal for prototype settlements above and for a reduction in labour productivity is nef-like in some ways. Nef’s vision of future living may have something in common with some possible prototypes.
However, the argument above is not for a forced abandonment of Smith’s division of labour. Rather, I argue for the creation of a rich gene pool of lifestyles, some of which might be appropriate for the difficult future ahead. They must, of course, generate little global pollution and perhaps some of them might be lifestyles that make life worth living.
The proposal could be seen in market terms. It is for R&D ready for the launch of new products onto the market. The products are local lifestyles. Lifestyles, which could for example be the sort that people would choose if the carbon price were set at $1000 per tonne – or greater (Note 2: Carbon price).
At $1000 a tonne, many residents of Orpington, would give up their car, stop buying flowers flown from Nairobi and possibly cut consumption of Spanish vegetables but they would be stuck in an Orpington unsuited to these conditions. Local life would need to be reorganised, The knowledge discovered by lifestyle prototypes would become valuable market information to entrepreneurs in the business of providing the infrastructure for ways of living appropriate to a large carbon tax.
R&D funding and direction needs be provided by a new innovative government department, which can break the mould of current failed ecotowns; something like DARPA, the government agency in the US that ignited the silicon revolution. In The Entrepreneurial State Debunking Public vs. Private Sector Myths, Mariana Mazzucato writes
The launching of Sputnik in 1957 by the Soviets led to an eruption of panic among US policymakers, fearful that they were losing the technological battle. The creation of DARPA in 1958 was a direct result. Before the formation of DARPA the military was the sole controller of all military R&D dollars.
Through the formation of DARPA a portion of military spending on R&D was now designated to ‘blue-sky thinking’ – ideas that went beyond the horizon in that they may not produce results for ten or twenty years. As a result of this mandate DARPA was free to focus on advancing innovative technological development with novel strategies. This opened numerous windows for scientists and engineers to propose innovative ideas and receive funding and assistance.
DARPA succeeded through public/private partnerships, Mazzucato also writes
These breakthroughs were the result of research carried out in various public–private partnerships at labs including those at DARPA, AT&T Bell Labs, Xerox PARC, Shockley and Fairchild, to name a few. Silicon Valley quickly became the nation’s ‘computer innovation hub’ and the resulting climate stimulated and nurtured by the government’s leading role in funding and research (both basic and applied) was harnessed by innovative entrepreneurs and private industry in what many observers have called the ‘Internet California Gold Rush’ or the ‘Silicon Gold Rush’ (Kenney 2003; Southwick 1999).
A difficulty for private sector lifestyle development is that the knowledge discovered from prototype lifestyle settlements cannot easily be captured as private property: Patents would be difficult to obtain on the layout, distribution chains and work patterns that might be built into a sustainable lifestyle. This may increase the level of funding necessary.
In As I’ve been saying the solution to climate change is a carbon tax, Timothy Worstall discusses rather modest carbon prices (between $5 and $80 per tonne of CO2), after rejecting James Hansen’s estimate of $1,000 per tonne. He concludes
one thing we did find out from that great experiment that was the 20th century is that the economy is too complex to use anything other than the market itself as the calculating engine about how to allocate resources.
Timothy, climate change should be an enormous “Sputnik moment” for all governments because the experiment we are conducting with the climate is turning out much wores than expected. We need a Department of New Lifestyle Design (is that DONALD?) with very deep pockets.
Note 1: Production and consumption
In a simple form of economic theory, production equals consumption plus investment. For the purposes of this note, I am assuming a close relationship between production and consumption and assuming investment is a form of deferred consumption.
Note 2: Carbon price
From the numbers in Climate and carbon emissions: It’s worse than you think it is clear that mass private transport by motor car is incompatible with sustainable living. A carbon tax of $1000 per tonne CO2 might not be high enough to discourage high levels of car ownership: If the present fuel duty of 57.95p per litre were to be regarded as a carbon tax, the rate of tax would be £334 ($410 US) a tonne. Reported elasticities of demand for petrol used in land transport indicate that price changes have limited effect on usage. $1000 per tonne CO2 is not enough by itself to banish private cars. Is this an indication that $1000 a tonne is too small?
However, there are great advantages to settlements if cars are banished. (See A parable of four villages and The parable of the smoking carriages.)
Geoff Beacon
6th March 2017
Some rewording 9th August 2017
comment
TrackBack URL :