
Cheating with temperature
Cheating with temperature.
United Nations and equitable sharing
Most of us struggle to find ways of making climate policy understandable. Recently I’ve looked at UN Resolution 42/187 now written into UK planning law. Paragraph 4 of Resolution 42/187 says
Agrees further that an equitable sharing of the environmental costs and benefits of economic development between and within countries and between present and future generations is a key to achieving sustainable development;
One of the consequences of the UN resolution is: One nation must not have a high carbon lifestyle and rely on other nations to have low carbon lifestyles. That’s not “equitable sharing”.
The UN resolution also implies a more difficult condition: Present generations must not screw the world up for future generations. That would not be an “equitable sharing” either.
These comparisons between nations should obviously be measured on a per capital basis e.g. In looking for equitable sharing between Britain and Italy, it is the emissions of the average Briton and the average Italian that should be compared.
The average is for a nation at a particular time, e.g. the year 1987. For measures over an extended number of years, it seems to make sense to add up yearly average per capita emissions for each year in order to make comparisons between countries.
The ‘average Briton’ will chafe a bit over the years because of births and deaths. Additionally there will be migration effects. However, these effects should not greatly affect the impact of UN 42/187 on national policy making for time spans of a few decades or so.
The remaining carbon budget
Worldwide greenhouse gas emissions can be added up to form a running total. (The world emits 40 billion tonnes CO2e this year, 39 tonnes next year so that’s 79 billion tonnes in two years and so on.) Then climate models can be used to estimate when this total reaches the point of no return for ‘global climate disaster’. The amount of greenhouse gases emitted to get to this point is called the remaining carbon budget. The usual use of ‘remaining carbon budget’ specifies the ‘global climate disaster’ in terms of the rise in average global temperature since pre-industrial times, typically 1.5°C or 2.0°C
One of the problems in using global temperature as an endpoint is that it then must be related to the real effects that matter: sea-level rise, droughts, floods, storms, crop failures, heat deaths, species extinctions & etc. No one seems sure of the relationship between temperature and these disasters. As the Tamino blog put’s it:
As bad as it is already, extremely bad is yet to come. Some say it’ll be when total warming since pre-industrial times reaches 2°C, others say — and I agree with them, given the costs we’ve already seen — that we’ll cross that threshold at 1.5°C. That’s the level at which the costs, both economically and in terms of human life and suffering, will threaten our ability to cope.
The meaning of ‘climate disaster’ for the Paris Agreement

Climate disaster means different things to different people in different nations. Sea level rise is important to the Small Island Developing States (SIDS) so they pressed for a low target for global temperature rise in the Paris Agreement:
SIDS succeeded to secure their special circumstances as vulnerable countries, demonstrated leadership in raising ambition to reduce greenhouse gas emissions to help secure an ambitious long-term temperature goal of limiting global warming to below 1.5 °C, and advanced the complex debate on loss and damage.
The Paris Agreement and climate change negotiations: Small Islands, big players
While keeping below 1.5°C may help towards reducing sea level rise, the long-term surface temperature of the Earth is not the strongest determinant of sea levels. Sea levels are affected by ocean heat content and to a lesser extent melt water from ground based ice masses. These do not have a direct functional relationship with the average temperature of the Earth.
Sea level rise and eating meat

Limiting long-term surface temperatures to 1.5 °C as a proxy for limiting sea level rise can mislead. Consider the paper A solution to the misrepresentations of CO2-equivalent emissions of short-lived climate pollutants under ambitious mitigation by Myles Allen et al. One of the authors, Dr Michelle Cain, explains in a video about the paper, that since methane has a lifetime of about 10 years it does not contribute much to long-term temperature rise and the goal of the Paris Agreement.
So methane has a short lifetime of about 10 years in the atmosphere where co2 persists in the atmosphere and accumulates so you don’t get that ongoing effect with methane because it reacts chemically in the atmosphere and then it’s gone.
Dr Michelle Cain. Transcript of video https://www.youtube.com/watch?v=HATNvcluCKE
However, the temporary warming caused by methane will have gone somewhere: A higher surface temperature for a decade or so will cause some of the heat to be lost to space but some of the warming will have contributed to melting ice sheets and a much larger amount will have warmed the oceans, raising sea levels.
In Emission metrics and sea level rise, Sterner and Azar, discuss sea level rise caused by short-lived pollutants, such as methane. Their conclusions show that methane is many times worse than CO2 – for sea level rise even though it does not affect log-term surface temperatures greatly.
Perhaps the Small Island Developing States must agree with Myles Allen, who thinks methane emissions from current meat production is not much of a problem:
“We don’t actually need to give up eating meat to stabilise global temperatures,” says Professor Myles Allen who led the study (meat production is a major source of methane). “We just need to stop increasing our collective meat consumption.”
But the Small Island Developing States might worry about our meat consumption (especially beef and lamb) because it causes significant sea-level rise through enhanced methane emissions – although it doesn’t affect long term average global temperatures much. (However, there is the worry that short term heating can cause the feedbacks discussed in Lowe & Bernie’s paper mentioned below).
The Jet Stream, climate variability and temperature
In recent years the Jet Stream, which contains Arctic air masses from more temperate regions has changed. The Jet stream is driven by the difference in temperature between the Polar Regions and Temperate Regions. A recent article by Stefan Rahmstorf, Europe’s freak weather, explained discusses the effects:
Researchers showed in 2015 that the jet stream has actually slowed down significantly in recent decades and undulates more. The cause is probably the strong warming of the Arctic, as the jet stream is driven by the temperature contrast between the tropics and the Arctic. Because this temperature difference is getting smaller and smaller, the jet stream is weakening and becoming less stable.
The consequence of Jet Stream changes is not linked to the average global temperature rise in a straightforward way. For a given global temperature, averaged over the Earth’s surface, the temperature gradients between Arctic and Temperate Regions may be different: If the temperature rise evens out the temperature difference (a greater temperature rise in the Arctic offset by a lower temperature rise elsewhere), it will cause more climate chaos. As Rahmsdoft noted: more floods, more droughts, more heat waves & more cold spells.
A ‘1.5°C rise in long-term global temperature’?
The stated aim of the Paris agreement is to limit long-term average global temperature rise to as near as possible to 1.5°C. The actual text says:
holding the increase in the global average temperature to well below 2°C above pre-industrial levels and pursuing efforts to limit the temperature increase to 1.5°C above pre-industrial levels
Getting the agreement of nations “that generate 55% of greenhouse gas emissions” was a political feat but “pursuing efforts” is disappointingly vague.
In addition, there are serious problems with the meaning of “limit the temperature increase to 1.5 °C above pre-industrial levels”. There are different opinions about the start date for measurement: When did the industrial period start? Further complications arise because there are different ways of estimating average global temperatures. One important measure, HADCRUT4, does not include the fastest warming part of the world – the Arctic.
Estimates for remaining carbon budgets
The table below gives estimates for the remaining carbon budget, using figures collected in the Carbon Brief article, Analysis: How much ‘carbon budget’ is left to limit global warming to 1.5C?. The figures are for a 66% chance of keeping below 1.5°C.
These are remaining carbon budgets are given in billion tonnes of CO2 (GtCO2) and converted to CO2e by a factor in line with the CO2e/CO2 ratio in UK national statistics, Greenhouse gas emissions in 2013. (CO2e figures are 18% higher than CO2 ones.) The last column scales the figures down by the current world population of 7.6 billion.
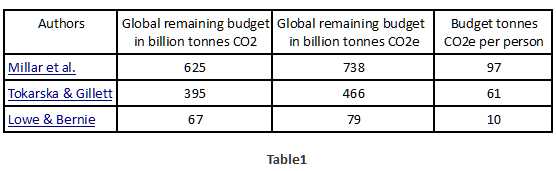
The differences in results in the first two rows are largely due to differences in the method of calculating the average global temperature. (Millar et al. used HADCRUT4. Tokarska & Gillett used a temperature measure that was globally-representative). However, these two results are from models that do not include some important climate feedbacks, such as carbon released by thawing permafrost or methane production from wetlands, as a result of climate change. These are taken into account in the last row based on modelling by Lowe & Bernie. Carbon Brief says:
[Lowe & Bernie] incorporate a wide range of additional feedbacks, some of which enhance and some of which reduce future emissions and resulting warming. They find that including these additional feedbacks results in a “well below” 1.5C carbon budget of between -192 GtCO2 and 243 GtCO2, with a best estimate of 67 GtCO2.
A better target: Limit GHG emissions
After the IPCC’s Fourth Assessment Report (AR4) in 2007, Mark Lynas published his book, Six Degrees: Our Future on a Hotter Planet. It detailed in a readable form the changes that were expected to happen to happen as global temperature rises. It described a relationship between the temperature rises and the climate change: 1°C will bring bad things; 2°C will bring worse … 6°C no life on Earth. It is a good example of how the relationship between temperature and climate disaster was set in many minds – mine included.
The Paris Agreement had vagueness in the wording “pursuing efforts to limit the temperature increase to 1.5 °C above pre-industrial levels”. Interpretations vary due to differences in the definitions of temperature and the nature of the climate models used. It has allowed a wide range of estimates for the remaining carbon budget: From Millar et al. at 625 Gt CO2 to Lowe & Bernie, who estimated 67 Gt CO2.
Even if these issues of definition and modelling were resolved, climate science is just not good enough to predict with accuracy the relationship between global average temperature and the important effects: sea level rise, floods, droughts, heat waves & cold spells.
Policies which reduce the bad effects of climate change, such as drowning Small Island Developing States, need as much clarity as possible.
An important mitigating action is limiting the global emissions of greenhouse gasses. Projected emissions can be put into climate models to predict the effects. A difficult but one-stage process.
The alternative chosen for the Paris Agreement is a two-stage process. Guess a temperature limit designed to avoid the worst effects then work out what projected emissions should be to stay within that limit. Once the projected emissions have been determined it’s possible to estimate when the Small Islands will drown – and many other climate effects.
Specifying emissions in an agreement would have enabled clarity in the assessment of national emissions and enabled better monitoring of equitable sharing. Contrast this to the specification of a temperature limit which gives estimates of anywhere between 10 tonnes CO2e per person to 97 tonnes per person.
If the agreement needed to be a simple one, why not start with 50 tonnes of CO2e per person as a ‘remaining carbon budget’ to last the next 47 years (That is before the world is meant to get to ‘zero net emissions’). Then monitor the progress of each nation’s emissions constantly and monitor the advance in the estimates of climate science as to the actual effects every year to reset the target in the light of developing climate parameters.
The cynical might argue that such an agreement would have been impossible: That getting the support of so many nations depended on a vagueness of ‘pursuing efforts to limit the temperature increase to 1.5 °C above pre-industrial levels’ that allowed nations to cheat.
Appendix 1
UK emissions
What if the target were as low as 10 tonnes CO2e per person, based on Lowe & Bernie’s paper? Most ‘developed’ countries are will exceed that in a year or so of emissions? The UK emissions before the ‘zero carbon date’ are about 160 tonnes CO2e per person.
The UK had carbon emissions of 800 million tonnes of CO2e in 1990. The UK Climate Change Act (2008) requires these emissions to fall by 80% by 2050 i.e. to 160 million tonnes CO2e. If the rate of decline achieved so far continued, zero emissions would happen at about 2065.
Recently the retirement of coal fired power stations has meant good progress in the reduction of emissions and statistics from the Department of Business, Energy and Industrial Strategy (BEIS), UK’s greenhouse gas emissions for 2017 were 456 million tonnes of CO2e. A steady decline for the 47 years from 2018 until 2065 would mean that the UK emitted 10,488 million tonnes CO2e. That’s about 160 tonnes CO2e for everyone in the UK …
… and rather more than the 50 tonnes CO2e target for remaining carbon budget suggested above.
[Note 4th February 2019: According to graph giving the BEIS statistics, the emissions in 2015 were 481 million tonnes CO2e. These don’t include emissions due to imports. The Department of Environment, Food and Rural Affairs publishes different figures that include imports. These showed that the UK’s emissions in 2015 were 847 million tonnes CO2e. i.e. 86% higher than the BEIS statistic]
Appendix 2
Dependence issues. Beef production and geo-engineering
It’s worth noting that average surface temperature and sea level rise are affected to different extents by different mixes of short and long term emissions and can be affected by national policies: Ban beef and lamb production and sea-level rise slows but this has less effect on long-term global temperature. This can be predicted by climate modelling.
Any functional independence between global average temperature and the waviness of the is more tenuous. For example, to slow the enhanced warming in the Arctic (to calm the Jet Stream) would need special measures. These would be classed as geo-engineering and would not be part of a national plan for emissions reduction.
Appendix 3
Representative Concentration Pathways
Representative Concentration Pathways (RCPs) give postulated emissions of important greenhouse gases (e.g. CO2, CH4,NO2) for years ahead. They were adopted by the IPCC in 2014 for explorations of the future climate by computer models. They are more detailed expression of emissions than ‘remaining carbon budget’, and an RCP could have been constructed to become the basis for the Paris Agreement so that emissions targets could be set on a year to year basis as a precursor to a process of ‘equitable sharing’ between nations.
The most optimistic of the RCP’s was called RCP 2.6. It postulated emissions of CO2 in 2017 of 37.23 GT CO2. In RCP2.6 the postulated emissions fall fairly steadily to zero until about 2080, before they become negative. Total postulated emissions under RCP2.6 are just over 1000 tonnes CO2.
The figure below is from the Global Carbon Budget 2015 and shows the results of climate simulations that are fed with RCP data. Note the numbers on the right hand side which give estimates of the ‘average global temperatures in 2010’, probably using the HADCRUT4 measure of temperature, which ‘ignores’ Arctic warming.

The usefulness of the RCP approach is that it allows the exploration the future climate possibilities and how they are driven by human greenhouse gas emissions. Even with a limited choice of four scenarios, this approach should have enabled a sensible framework for discussion. I have downloaded data from IIASA, which gives the emissions, associated with each RCP scenario. I counted up the CO2 emissions for Fossil fuels, Industry and Land Use Change over the 2017 to 2100 period for each scenario. This could have provided this choice at the Paris Conference:
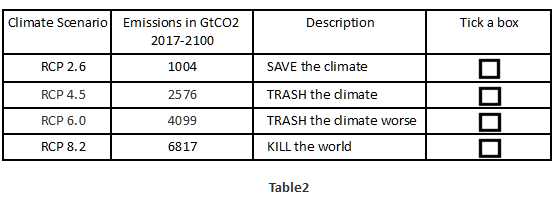
Before the Paris Agreement, the RCP2.6 emission and concentration pathway was regarded as the scenario to limit the increase of global mean temperature to 2°C. But with the Paris Agreement, the aim became to try and keep the within a rise of 1.5°C.
The new aim, has meant that even the greenhouse gas emissions postulated in RCP2.6 are too great. In Table 2 the description for RCP 2.6 should be “Won’t save the climate”.
We must do better.
TrackBack URL :