
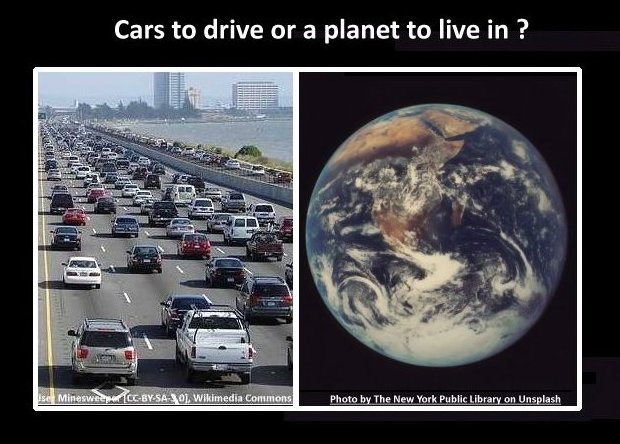
Cars to drive or a planet to live in? A numerical assessment.
A numerical assessment – Cars to drive or a planet to live in?
The House of Commons Science and Technology Committee reported:
In the long-term, widespread personal vehicle ownership does not appear to be compatible with significant decarbonisation.
Was the committee correct?
A crude test is to compare personal remaining carbon budgets with the emissions from personal vehicles, aka cars.
The fair personal remaining carbon budget
The remaining carbon budget how much CO2 can be released into the atmosphere to limit global warming to a given temperature.
Tim Jackson has estimated the UK’s fair share of the remaining carbon budget. For a 1.5°C rise (with a 66% chance of success) the UK’s share is 2.5 billion tonnes CO2. With a UK population of 66 million, this amounts to a “fair personal remaining carbon budget” of 38 tonnes CO2.
Rogelj et al. have estimated that to keep the Earth’s temperature rise to a maximum of 1.5°C (with a 66% chance of success) the remaining carbon budget is 320 billion tonnes of CO2. With a global population of 7.8 billion, that amounts to just over 40 tonnes CO2 each.
These estimates are for CO2 only: They do not include the effects of other greenhouse gases such as methane and nitrous oxide. To account for the effect of these other gases a composite measure CO2 equivalent (CO2e) is often used. There are various estimates of the relationship between CO2 and CO2e. As a rule-of-thumb, it will be assumed here that for emissions of each tonne CO2 will translate to 1.25 tonnes of CO2e, an increase of 25%. (See Appendix CO2e)
Measurement of the emissions from specific activities (e.g. buying flowers flown from Nairobi or driving a car from London to Leeds) are usually measured in CO2e.
Using the estimates of Jackson and Rogelj et al., a guide for a fair personal remaining carbon budget is here assumed to be 50 tonnes CO2e – from the start of 2019.
Households with cars have large carbon footprints
The Joseph Rowntree Foundation commissioned researchers at the University of York to look at the new development at Derwenthorpe, York, using their REAP Petite software. Derwenthorpe was meant to be a sustainable development with a low carbon footprint but the results indicated that it achieved a footprint of 14.52 tonnes CO2e per resident per year. (Note: That is per resident not per household.)
World average emissions of CO2e are now about 7 tonnes CO2e per person per year. If this rate of emissions were maintained, the personal fair remaining carbon budget would be reached in seven years. If emissions steadily declined to zero over 15 years (i.e. By 2035) this budget limit would also be reached.
Derwenthorpe residents would reach the budgetary limit in less than 3.5 years: They could stretch that to 4 years by cutting their emissions by an unlikely 15% a year.
The emissions by Derwenthorpe residents were reduced due to the central wood chip burner that provides their heating, but their carbon footprint for travel was estimated at 45% higher than York’s average. Car use is the important part of this : “Despite only one car space per household, few households had reduced their car use substantially”
The aim of the developers was to reduce car dependency in Derwenthorpe but not to reduce the level of car ownership. They aimed to promote alternative transport modes by a choice-based approach so residents could ‘decide for themselves to use their car less’. Note that of the sample of 40 residents measured at Derwenthorpe, the lowest carbon footprint was in the household without a car.
Research by the University of Leeds, Carbon reduction and travel behaviour, has shown choice-based approaches to be of limited value :
We have suggested that in this English and Scottish case study decision-makers accept the argument that choice-based approaches will lack effectiveness in reducing carbon, and that substantial change requires changing the conditions and circumstance which shape possible behaviours.
This confirms the idea that giving residents the option of owning a car but trying to promote alternative transport methods does not work well. The conclusion must be that residential areas should be car-free to achieve significant decarbonisation, in line with the conclusion of the House of Commons Science and Technology Committee, mentioned above.
Categories of cars
The two relevant categories of cars are those powered by Internal Combustion Engines (ICE cars) and Battery Electric Vehicles (BEV cars). The consensus is that BEV cars have higher embodied carbon, due to the manufacture of the batteries, but cause lower emissions in use. However, the in-use emissions of BEVs are dependent on the carbon intensity of the electricity used to charge the batteries. This varies for different regions and countries.
There are many estimates of the carbon footprints of these categories. These footprints have two main components: the emissions from manufacture (called the embodied carbon in the car) and the emissions from driving.
Methods of estimated embodied carbon
There is a marked difference between two methods of estimation for embodied carbon: bottom-up (LCA) estimates and top-down (IO table) estimates. Bottom-up estimates look at the carbon emissions in the materials used to manufacture cars, plus the emissions estimated for the energy used in the assembly into the final product.
As Mike Berners-Lee explains in “How bad are Bananas”, top-down methods start by looking at the whole economy from a height. It uses macroeconomic modelling to understand the way in which the activities of one industry trigger activities and emissions in every other industry.
Top down methods are theoretically more complete but are harder to use. They give higher estimates of embodied carbon than bottom-up methods. There some explanation of the difference in the TEDx talk by Guillaume Majeau-Bettez.
In another example the publication, Under construction, from the New Zealand Green Building Council reports:
The top-down MFA reveals that the bottom-up calculations of building material consumption are in the same order of magnitude as the available national consumption figures, but on the low side. …
(in bottom-up calculations) concrete was nearly 30% lower, reinforcing steel over 10% lower. Timber consumption was significantly lower than the available data.
Estimates embodied carbon in cars
There is a wide range of estimates for the embodied carbon in cars. For example, the Low Carbon Vehicle Partnership estimate the embodied carbon in a “standard mid-sized gasoline ICE” to be 5.6 tonnes CO2e whereas Mike Berners Lee top-down estimates give the embodied carbon in a Ford Mondeo as 17 tonnes CO2e – three times greater.
There are some top-down estimates of the embodied carbon in ICE vehicles but there do not seem to be top-down estimates for complete BEVs. However, there are top-down estimates of embodied carbon in BEV batteries. Hall and Lutsey compare estimates of the carbon emissions due to battery manufacture. The estimates which used top-down analysis were significantly higher than those using bottom-up analysis.
The attached spread sheet (in PDF form) shows an attempt to make sense of some of the reports of the carbon emissions of cars during their lifetime. Here are tables that summarise the “results” for mid-sized cars. Assume car lifetimes are in the range 12 to 15 years.
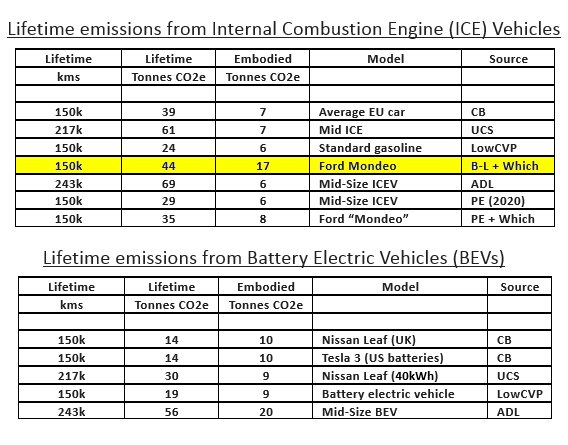
(40kWh Nissan Leaf has 84 Mile range, 75 kwh Tesla Model S7 has a 249 Mile range.)
The one that stands out is Berners-Lees’ estimate of the embodied carbon in a Ford Mondeo. It is the only estimate that uses top-down analysis and the estimate is roughly 10 tonnes CO2e higher than the others for ICEVs. All the estimates for BEV cars have used bottom-up analysis for estimating embodied carbon, suggesting that these estimates are too low – if top-down analysis is better than bottom-up analysis.
In the estimates of BEVs, the highest estimate is from the consultancy Arthur D Little. Their estimates include the embodied carbon in a replacement battery and, in use, the occasion drive in an ICE vehicle when the BEV range is too restrictive.
Estimates of lifetime emissions
This sample of estimates of the carbon footprint of cars has a wide range, with lifetime footprints centering around 40 tonnes CO2e for mid-range ICE cars and 25 tonnes CO2e for mid-range BEVs. Both these might be higher if top-down methods for estimating embodied carbon were used.
(Lifetimes are a bit less than 15 years.)
Car footprints and the remaining carbon budget.
For the sake of discussion, let us divide the “fair remaining carbon budget” of 50 tonnes CO2e equally between categories “consumables”, “building”, “transport” and “government”. This gives 12.5 tonnes per person per category.
There are 32.5 million cars in the UK. In car owning households, that is more than one for every two people. For two people the remaining carbon budget for transport would be 25 tonnes CO2e. This means a new ICEV car would swamp this transport budget and a new BEV car would exhaust it in its lifetime.
After one car’s lifetime, will the owner buy another one more car?
The emissions from surface transport have not been falling
According to UK Government’s latest statistics, Roads and Traffic(TSGB07), cars made up 78% of the distance travelled on the roads. Also according to data from the Committee on Climate Change charted by the New Scientist, it can be seen that emissions from surface transport have not fallen and that surface transport has overtaken the power sector as the UK’s biggest emitter.
Although no progress has been made in reducing the emissions from surface transport, many reports and commentators assume that the switch from ICE vehicles to electric vehicles will drastically cut emissions as the carbon intensity of the electricity grid and manufacturing processes reduces. Two comments are these:
First, the large embodied carbon in a Battery Electric Vehicle happens now using today’s manufacturing processes. For example, the steel used will not be low carbon steel from a process based on a cleaner hydrogen technology.
Second, when in use the BEV will initially be clocking up carbon emissions by using today’s electricity rather than lower projected ones for some future date.
Third, the enormous amount of productive capacity dedicated to car manufacture should be stopped because of its emissions or diverted to a green transition.
Well before any projected date for BEVs with sensibly low emissions, the personal fair remaining carbon budget will be exhausted.
Summary
In households with at least one car, the carbon footprints of members of the household are very likely to exceed the fair remaining personal carbon budget in a handful of years. This leads to the same conclusion as the House of Commons Science and Technology Committee:
In the long-term, widespread personal vehicle ownership does not appear to be compatible with significant decarbonisation.
The House of Commons Science and Technology Committee was correct. We have this choice:
Cars to drive or a planet to live in?
Appendix CO2e
The UK Government’s publication UK_Carbon_Footprint_1997_2016 gives the carbon footprint of the UK from 1997 to 2016 based on UK consumption. It gives measures in terms of CO2 and CO2e. On average the measures in terms of CO2e are 30% higher than those in terms of CO2.
Another ONS publication Greenhouse gas emissions: 2013, says that CO2 was 84.4% UK emissions so the measure in terms of CO2e. As 100% is 18% higher than 84.4%, here the emissions in CO2e are reported as being 18% numerically higher than the emissions measured as CO2.
As a rough and ready estimate, in this note it is assumed that a budget of 40 tonnes CO2 has about the same effect as a budget of 50 tonnes CO2e.
Postscript 22 April 2020: Transport & Environment
New discussions about the carbon footprints of a range of cars (petrol, diesel and electric) have been published in How clean are electric cars? by Transport & Environment .
A relevant addition has been made to the attached spreadsheet. The following is a table from the spreadsheet. Some details of the working can be found there.
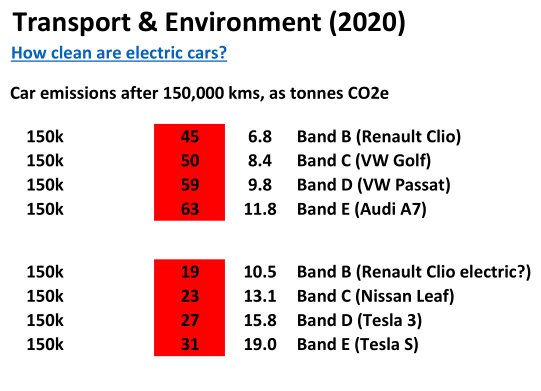
These estimates seem to be in-line with others in this piece.
Tweets:
The Polestar Battery Electric car from Volvo ” leaves the factory with a 26-tonne carbon footprint.”
1/2) Video presenting Auke Hoekstra's estimates of cars' embodied CO2:
— Geoff Beacon (@GeoffBeacon) January 10, 2021
Mercedes C220 diesel …. 8 tonnes
Tesla Model 3 … 12.6 tonnes
In the same range as some studies in "Cars to drive or a planet to live in" but …https://t.co/gkoZdiJa4F
Figures from “How Bad are Bananas” by Mike Berners-Lee
comment
TrackBack URL :
Another view:
How green is an electric car, really?
https://www.topgear.com/car-news/electric/how-green-electric-car-really